Ch 18: A Macroscopic Description of Matter
Knight Calc - Physics for Scientists and Engineers 5th Edition
Knight Calc5th EditionPhysics for Scientists and EngineersISBN: 9780137344796Non è quello che usi tu?Cambia libro di testo
Capitolo 18, Problema 59b

In Problems 67,68,69,67, 68, 69, and 7070 you are given the equation(s) used to solve a problem. For each of these, you are to draw a pV diagram.
(T2+273) K=200 kPa500 kPa×1×(400+273) K(T_2 + 273) \(\text{ K}\) = \(\frac{200 \text{ kPa}\)}{500 \(\text{ kPa}\)} \(\times\) 1 \(\times\) (400 + 273) \(\text{ K}\)

Guida verificata passo dopo passo
1
Step 1: Understand the given equation. The equation provided is used to calculate the final volume (V₂) of a gas using the relationship between temperature and volume, which is derived from Charles's Law: \( \frac{V_1}{T_1} = \frac{V_2}{T_2} \). This law states that for a fixed amount of gas at constant pressure, the volume is directly proportional to its temperature in Kelvin.
Step 2: Convert the temperatures from Celsius to Kelvin. The temperatures \( T_1 \) and \( T_2 \) are given as 50°C and 400°C, respectively. To convert to Kelvin, use the formula \( T(K) = T(°C) + 273 \). Substitute the values to find \( T_1 \) and \( T_2 \).
Step 3: Substitute the known values into the equation. The initial volume \( V_1 \) is given as 200 cm³, and the temperatures \( T_1 \) and \( T_2 \) are now in Kelvin. Plug these values into the equation \( V_2 = \frac{T_2}{T_1} \times V_1 \).
Step 4: Simplify the equation to find \( V_2 \). Perform the division \( \frac{T_2}{T_1} \) and multiply the result by \( V_1 \). This will give the final volume \( V_2 \).
Step 5: Draw the pV diagram. A pV diagram plots pressure (p) versus volume (V). Since the problem involves a change in volume due to temperature at constant pressure, the graph will show a linear relationship between volume and temperature. Label the initial and final volumes \( V_1 \) and \( V_2 \) on the x-axis, and ensure the pressure remains constant along the y-axis.

Risposta video verificata per un problema simile:

Questa soluzione video è stata consigliata dai nostri tutor come utile per risolvere questo problema.
Durata del video:
7m

Concetti chiave

Ecco i concetti essenziali che devi comprendere per rispondere correttamente alla domanda.

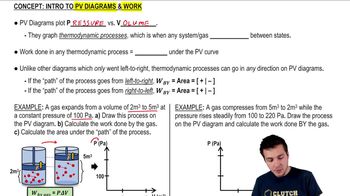
pV Diagram

A pV diagram, or pressure-volume diagram, is a graphical representation of the relationship between the pressure (p) and volume (V) of a gas during a thermodynamic process. It helps visualize how the state of a gas changes under different conditions, such as isothermal or adiabatic processes. The area under the curve in a pV diagram represents the work done by or on the gas.
Video consigliato:
Percorso guidato
08:07
Work and PV Diagrams

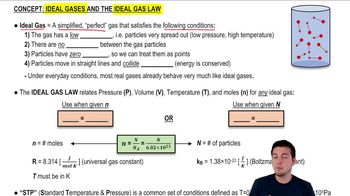
Ideal Gas Law

The Ideal Gas Law is a fundamental equation in thermodynamics that relates the pressure, volume, temperature, and number of moles of an ideal gas. It is expressed as PV = nRT, where P is pressure, V is volume, n is the number of moles, R is the ideal gas constant, and T is temperature in Kelvin. This law provides a basis for understanding the behavior of gases under various conditions.
Video consigliato:
Percorso guidato
07:21
Ideal Gases and the Ideal Gas Law

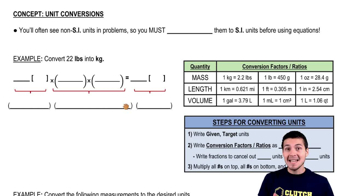
Temperature Conversion

Temperature conversion is the process of changing a temperature value from one scale to another, such as from Celsius to Kelvin. In thermodynamics, Kelvin is the standard unit of temperature, where 0 K is absolute zero. The conversion from Celsius to Kelvin is done by adding 273.15 to the Celsius temperature, which is crucial for calculations involving gas laws and thermodynamic equations.
Video consigliato:
Percorso guidato
07:46
Unit Conversions
Pratica correlata
Domanda del libro di testo

A diver 50 m deep in 10°C fresh water exhales a 1.0-cm-diameter bubble. What is the bubble's diameter just as it reaches the surface of the lake, where the water temperature is 20°C?

1958
views

Domanda del libro di testo

The 50 kg circular piston shown in FIGURE P18.57 floats on 0.12 mol of compressed air. How far does the piston move if the temperature is increased by 100°C?

1560
views
Domanda del libro di testo

10 g of dry ice (solid CO₂) is placed in a 10,000 cm3 container, then all the air is quickly pumped out and the container sealed. The container is warmed to 0°C, a temperature at which CO₂ is a gas. What is the gas pressure? Give your answer in atm. The gas then undergoes an isothermal compression until the pressure is 3.0 atm, immediately followed by an isobaric compression until the volume is 1000 cm3.

1888
views
Domanda del libro di testo

The 50 kg circular piston shown in FIGURE P18.57 floats on 0.12 mol of compressed air. What is the piston height h if the temperature is 30°C?

1946
views
Domanda del libro di testo

A container of gas at 2.0 atm pressure and 127°C is compressed at constant temperature until the volume is halved. It is then further compressed at constant pressure until the volume is halved again. Show this process on a pV diagram.

2151
views
Domanda del libro di testo

Five grams of nitrogen gas at an initial pressure of 3.0 atm and at 20°C undergo an isobaric expansion until the volume has tripled. What is the gas volume after the expansion?

1528
views