
Ch 39: Wave Functions and Uncertainty
Knight Calc - Physics for Scientists and Engineers 5th Edition
Knight Calc5th EditionPhysics for Scientists and EngineersISBN: 9780137344796Non è quello che usi tu?Cambia libro di testo
Capitolo 39, Problema 31b

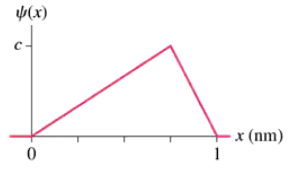
FIGURE P39.31 shows the wave function of a particle confined between x = 0 nm and x = 1.0 nm. The wave function is zero outside this region. Draw a graph of the probability density P(x)=|ψ(x)|2

Guida verificata passo dopo passo
1
Understand the problem: The wave function ψ(x) represents the quantum state of a particle confined between x = 0 nm and x = 1.0 nm. The probability density P(x) is given by P(x) = |ψ(x)|², which represents the likelihood of finding the particle at a specific position x within the region. Outside this region, ψ(x) = 0, so P(x) = 0.
Step 1: Analyze the given wave function ψ(x). Carefully examine the shape of ψ(x) as shown in FIGURE P39.31. Identify any key features such as peaks, nodes (where ψ(x) = 0), and symmetry. These features will influence the shape of P(x).
Step 2: Compute the probability density P(x). For each value of x within the region (0 nm ≤ x ≤ 1.0 nm), calculate P(x) = |ψ(x)|². This involves squaring the magnitude of ψ(x) at each point. If ψ(x) is complex, take the modulus squared: |ψ(x)|² = ψ(x)ψ*(x), where ψ*(x) is the complex conjugate of ψ(x).
Step 3: Plot the graph of P(x). Use the calculated values of P(x) to create a graph. The x-axis represents the position (x), and the y-axis represents the probability density P(x). Ensure the graph reflects the squared nature of ψ(x), meaning peaks in ψ(x) will correspond to peaks in P(x), and nodes in ψ(x) will correspond to zeros in P(x).
Step 4: Interpret the graph. The graph of P(x) should show where the particle is most likely to be found within the region. Areas with higher values of P(x) indicate higher probabilities, while areas with P(x) = 0 indicate no likelihood of finding the particle there. Confirm that P(x) = 0 outside the region (x < 0 nm and x > 1.0 nm).

Concetti chiave

Ecco i concetti essenziali che devi comprendere per rispondere correttamente alla domanda.

Wave Function (ψ)

The wave function, denoted as ψ(x), is a fundamental concept in quantum mechanics that describes the quantum state of a particle. It contains all the information about the particle's position and momentum. The wave function can take on complex values, and its square modulus, |ψ(x)|^2, represents the probability density of finding the particle at a specific position x.
Video consigliato:
Percorso guidato
08:30
Intro to Wave Functions

Probability Density

Probability density, represented as P(x) = |ψ(x)|^2, quantifies the likelihood of locating a particle within a given region of space. It is derived from the wave function and is always non-negative. The integral of the probability density over a specific interval gives the probability of finding the particle in that interval, ensuring that the total probability across the entire space equals one.
Video consigliato:
Percorso guidato
8:13
Intro to Density

Normalization of the Wave Function

Normalization is a crucial process in quantum mechanics that ensures the total probability of finding a particle in all space equals one. For a wave function to be physically meaningful, it must be normalized, which involves adjusting the wave function so that the integral of the probability density over the entire space equals one. This ensures that the wave function accurately reflects the probabilities of the particle's position.
Video consigliato:
Percorso guidato
08:30
Intro to Wave Functions
Pratica correlata
Domanda del libro di testo

FIGURE P39.31 shows the wave function of a particle confined between x = 0 nm and x = 1.0 nm. The wave function is zero outside this region. Calculate the probability of finding the particle in the interval 0 nm ≤ x ≤ 0.25 nm.

46
views
Domanda del libro di testo

FIGURE P39.31 shows the wave function of a particle confined between x = 0 nm and x = 1.0 nm. The wave function is zero outside this region. Determine the value of the constant c, as defined in the figure.

328
views
Domanda del libro di testo

Consider the electron wave function ψ(x)={c1−x2∣x∣≤1 cm0∣x∣≥1 cm\(\psi\) (x)=\(\begin{cases}\) c\(\sqrt{1-x^{2}\)} & \(\left\)|x\(\right\)|\(\leq\) 1\(\text{ cm}\) \\ 0 & \(\left\)|x\(\right\)|\(\geq\) 1\(\text{ cm}\) \(\end{cases}\) where x is in cm. Draw a graph of ψ(x) over the interval −2 cm ≤ x ≤ 2 cm. Provide numerical scales on both axes.

42
views
Domanda del libro di testo

An experiment finds electrons to be uniformly distributed over the interval 0 cm ≤ x ≤ 2 cm, with no electrons falling outside this interval. If 106 electrons are detected, how many will be detected in the interval 0.79 to 0.81 cm?

60
views
Domanda del libro di testo

Consider the electron wave function ψ(x)={c1−x2∣x∣≤1 cm0∣x∣≥1 cm\(\psi\) (x)=\(\begin{cases}\) c\(\sqrt{1-x^{2}\)} & \(\left\)|x\(\right\)|\(\leq\) 1\(\text{ cm}\) \\ 0 & \(\left\)|x\(\right\)|\(\geq\) 1\(\text{ cm}\) \(\end{cases}\) where x is in cm. Determine the normalization constant c.

57
views
Domanda del libro di testo

An experiment finds electrons to be uniformly distributed over the interval 0 cm ≤ x ≤ 2 cm, with no electrons falling outside this interval. What is the probability density at x = 0.80 cm?

68
views