 Indietro
Designing Observational Studies and Experiments: Foundations of Introductory Statistics
Guida di studio - Note intelligenti
 Appunti personalizzati basati sui tuoi materiali, ampliati con definizioni chiave, esempi e contesto.
Designing Observational Studies and Experiments
Section 2.1: Simple Random Sampling
Simple random sampling is a fundamental method in statistics for selecting a subset of individuals from a population, ensuring each individual has an equal chance of being chosen. This section introduces key concepts and terminology essential for understanding how data is collected and analyzed in statistics.
Individuals: The people or objects we want to learn about in a study.
Variables: Characteristics of individuals that are measured or observed.
Observations: The data values recorded for each variable.
Data: Facts or propositions used to draw conclusions or make decisions.
Example: In a study of movies with the largest worldwide gross receipts, the individuals are the movies, the variable could be gross receipts, and the observations are the actual gross values for each movie.
Five Steps of Statistics
Statistics involves a systematic process to answer questions about variables. The five steps are:
Raise a precise question about one or more variables.
Create a plan to answer the question, including study design.
Collect the data from individuals using appropriate methods.
Analyze the data using tables, graphs, and calculations.
Draw a conclusion about the question, often leading to further research.
Example: In a study testing Motivational Enhancement Therapy (MET) for drug abusers, researchers followed these steps: posed a question about MET's effectiveness, designed a plan with two groups, collected questionnaire data, analyzed results, and concluded MET was effective.
Populations and Samples
Understanding the distinction between populations and samples is crucial in statistics. The population is the entire group of interest, while a sample is a subset selected for study.
Population: The complete set of individuals about which information is sought.
Sample: A part of the population from which data are collected.
Sampling: The process of selecting a sample from the population.
Individual: A single member of the population.
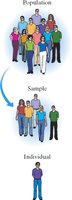
Example: In a survey of 1024 American adults about same-sex marriage, the sample is the 1024 surveyed, the population is all American adults, and the variable is the opinion on same-sex marriage.
Statistics and Parameters
Statistics and parameters are numerical summaries that describe samples and populations, respectively.
Statistic: A numerical summary based on a sample.
Parameter: A numerical summary of a population.
Example: The average score of a class (sample) is a statistic; the average score of all students (population) is a parameter.
Descriptive and Inferential Statistics
Statistics is divided into two main branches:
Descriptive statistics: Organizing and summarizing data using numerical summaries, tables, and graphs.
Inferential statistics: Methods that use sample results to make generalizations about the population and measure reliability.
Example: Reporting that "66% of respondents believe genocide is preventable" is descriptive; stating "66% of Americans believe genocide is preventable" is inferential.
Simple Random Sampling
Simple random sampling ensures every member of the population has an equal chance of being selected. This method reduces bias and increases the reliability of statistical conclusions.
Random selection: Assigning numbers to individuals and using technology to select a sample without replacement.
Statistic vs. Parameter: The proportion of female students in a sample is a statistic; the proportion in the entire population is a parameter.
Example: If 591 out of 1000 randomly selected students are female, the sample proportion is .
Sampling Error and Bias
Sampling error arises from using a sample to estimate population information due to randomness. Bias occurs when the sampling method systematically favors certain groups.
Sampling error: Error due to random variation in the sample.
Sampling bias: Technique favors one group over another.
Nonresponse bias: Individuals refuse participation or cannot be contacted.
Response bias: Answers do not reflect true opinions, possibly due to question wording.
Example: Surveying only students in the library may introduce sampling bias; a call-in survey may have response bias.
Sampling and Nonsampling Error
Nonsampling error results from biased sampling, incorrect data recording, or improper analysis. Both sampling and nonsampling errors affect the accuracy of statistical conclusions.
Nonsampling error: Errors not related to random sampling, such as data entry mistakes or flawed study design.
Section 2.3: Observational Studies and Experiments
Components of a Good Study
Well-designed studies distinguish between treatment and control groups and use random assignment to minimize bias. Key components include:
Treatment group: Individuals receiving the treatment or characteristic of interest.
Control group: Individuals not receiving the treatment.
Placebo: An inactive treatment used to control for psychological effects.
Single-blind: Participants do not know which group they are in.
Double-blind: Neither participants nor researchers know group assignments.
Random assignment: Individuals are randomly assigned to groups to ensure comparability.
Sample size: Large enough to detect meaningful effects.
Each treatment group should be as similar as possible to the control group, except for the characteristic of interest.
Experiments vs. Observational Studies
Experiments involve actively assigning treatments to groups, while observational studies simply observe existing conditions without intervention.
Explanatory variable: The variable manipulated or categorized in an experiment.
Response variable: The outcome measured in the study.
Association vs. Causation: Observational studies can show association, but only experiments can establish causation.
Lurking variable: A variable not included in the study that may affect the response.
Confounding variable: A variable that is related to both the explanatory and response variables, making it difficult to determine causation.
Example: Redesigning an observational study into an experiment involves random assignment and control of confounding variables.
