Ch. 6 - Confidence Intervals
Larson - Elementary Statistics: Picturing the World 8th Edition
Larson8th EditionElementary Statistics: Picturing the WorldISBN: 9780137493470Non è quello che usi tu?Cambia libro di testo
Capitolo 6, Problema 6.1.20

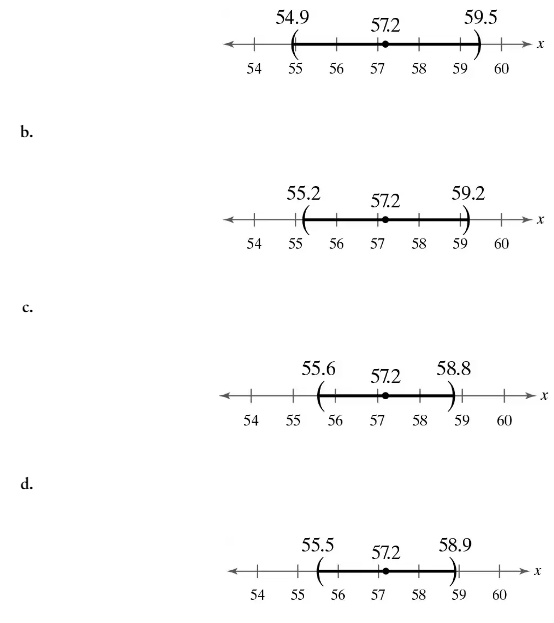
Matching In Exercises 17–20, match the level of confidence c with the appropriate confidence interval. Assume each confidence interval is constructed for the same sample statistics.
c = 0.98
Four horizontal number lines displaying confidence intervals for a population mean, labeled a, b, c, and d.

Guida verificata passo dopo passo
1
Step 1: Understand that the level of confidence (c) determines the width of the confidence interval. Higher confidence levels correspond to wider intervals because they need to capture more possible values of the population parameter.
Step 2: Observe the given confidence intervals in the images (a, b, c, d). The intervals are centered around the same sample statistic (57.2), but their widths vary.
Step 3: Recall that a confidence level of c = 0.98 is relatively high, meaning the interval should be wider compared to lower confidence levels (e.g., c = 0.90 or c = 0.95). This ensures that the interval captures the true population parameter with 98% confidence.
Step 4: Compare the intervals visually. The widest interval corresponds to image (a), which spans from 54.9 to 59.5. This is likely the interval for c = 0.98 because it is the widest among the options.
Step 5: Match the confidence level c = 0.98 with the interval in image (a), as it provides the necessary width to achieve the specified level of confidence.

Risposta video verificata per un problema simile:

Questa soluzione video è stata consigliata dai nostri tutor come utile per risolvere questo problema.
Durata del video:
2m

Concetti chiave

Ecco i concetti essenziali che devi comprendere per rispondere correttamente alla domanda.

Confidence Interval

A confidence interval is a range of values derived from sample statistics that is likely to contain the true population parameter. It is expressed as an interval estimate, typically calculated using the sample mean and a margin of error, which is influenced by the desired confidence level. For example, a 98% confidence interval suggests that if we were to take many samples, approximately 98% of the calculated intervals would contain the true population mean.
Video consigliato:
Percorso guidato
06:33
Introduction to Confidence Intervals

Confidence Level

The confidence level represents the probability that the confidence interval will contain the true population parameter. Common confidence levels include 90%, 95%, and 99%, with higher levels indicating greater certainty but resulting in wider intervals. In this case, a confidence level of 0.98 means there is a 98% chance that the interval calculated from the sample data includes the true mean.
Video consigliato:
Percorso guidato
06:33
Introduction to Confidence Intervals

Margin of Error

The margin of error quantifies the amount of random sampling error in a survey's results. It is the range within which the true population parameter is expected to fall, calculated as a function of the standard error and the critical value associated with the desired confidence level. A larger margin of error indicates less precision in the estimate, while a smaller margin suggests more precision, which is crucial when determining the appropriate confidence interval.
Video consigliato:
Percorso guidato
04:08
Finding the Minimum Sample Size Needed for a Confidence Interval