
Domanda del libro di testo
Fill in the blank(s) to correctly complete each sentence.
The graph of y = sin (x + π/4) is obtained by shifting the graph of y = sin x ______ unit(s) to the ________ (right/left).
741
views

 Guida verificata passo dopo passo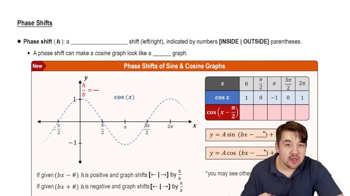
 6:31
6:31
 5:53
5:53 5:25
5:25Fill in the blank(s) to correctly complete each sentence.
The graph of y = sin (x + π/4) is obtained by shifting the graph of y = sin x ______ unit(s) to the ________ (right/left).
An object in simple harmonic motion has position function s(t), in inches, from an equilibrium point, as follows, where t is time in seconds.
𝒮(t) = 5 cos 2t
What is the frequency?
An object in simple harmonic motion has position function s(t), in inches, from an equilibrium point, as follows, where t is time in seconds.
𝒮(t) = 5 cos 2t
What is the amplitude of this motion?
Fill in the blank(s) to correctly complete each sentence.
The graph of y = 4 sin x is obtained by stretching the graph of y = sin x vertically by a factor of ________.
An object in simple harmonic motion has position function s(t), in inches, from an equilibrium point, as follows, where t is time in seconds.
𝒮(t) = 5 cos 2t
What is the period of this motion?