 뒤로
Ecosystem Ecology, Trophic Levels, Biomass Transfer, Nutrient Cycles, NPP, Aquatic Zones, Water Cycle, and Soil
스터디 가이드 - 스마트 노트
 자료에 맞춘 맞춤형 노트, 핵심 정의, 예시, 맥락을 확장해 제공합니다.
Ecosystem Ecology
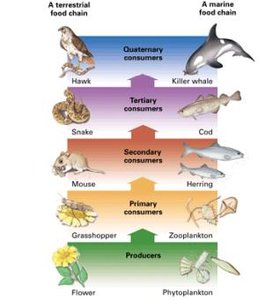
Trophic Levels
Ecosystem ecology examines the flow of energy and nutrients through living organisms and their environment. Trophic levels describe the position an organism occupies in a food chain, which is fundamental to understanding ecosystem structure and function.
Autotrophs: Organisms that produce their own food via photosynthesis (e.g., plants, algae, cyanobacteria).
Heterotrophs: Organisms that consume other organisms for food.
Herbivores: Eat primary producers (plants).
Omnivores: Eat both plants and animals.
Carnivores: Eat animals.
Detritivores: Convert dead plant/animal matter from organic to inorganic compounds, facilitating nutrient recycling.
Biomass Transfer Efficiency
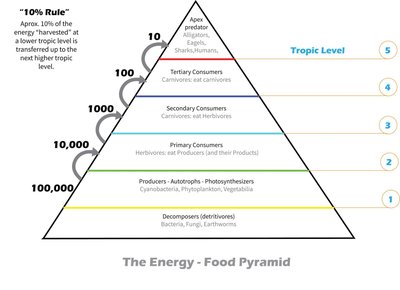
Energy Transfer Between Trophic Levels
Biomass transfer efficiency refers to the proportion of energy transferred from one trophic level to the next. Only a small fraction of energy is converted into biomass at each level.
Organisms convert up to 10% of the chemical energy from food into energy stored as body tissues (biomass).
Each time energy moves up a trophic level, 90% of energy is lost, mainly as heat.
Example: To support one herbivore, 10 primary producers are needed; to support one secondary consumer, 10 primary consumers are required.
Nutrient Cycles
Major Biogeochemical Cycles
Nutrient cycles transfer energy and matter between living organisms and the non-living environment. These cycles are essential for ecosystem sustainability.
Carbon Cycle: Primary producers convert inorganic carbon (CO2) into carbohydrates via photosynthesis. These carbohydrates fuel metabolic processes.
Nitrogen Cycle: Involves the transformation and movement of nitrogen through the environment and living organisms.
Water Cycle: Describes the movement of water through the biosphere, atmosphere, and geosphere.
Oxygen Cycle: Involves the production and consumption of oxygen in the environment.
Net Primary Productivity (NPP)
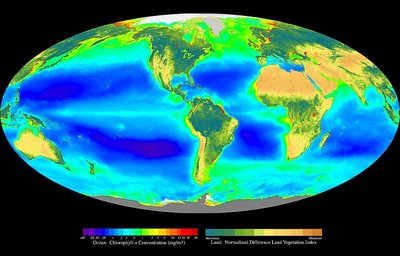
NPP: The rate per unit area at which an ecosystem creates primary producers (biomass).
Estimated by measuring wavelengths of light reflected from Earth's surface and mapping photosynthetic biomass.
Terrestrial NPP
Factors Affecting Terrestrial NPP
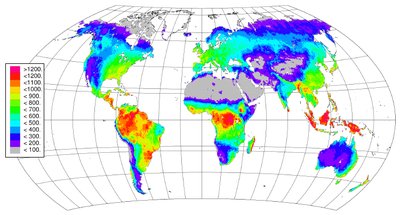
Terrestrial NPP varies with environmental conditions and soil composition.
Increases with temperature and precipitation up to a threshold (2400 mm/year), then decreases at higher levels.
Photosynthetic enzyme activity increases with temperature until denaturation occurs.
Moist soil conditions facilitate water and nutrient uptake, maximizing CO2 absorption.
Excessive moisture can reduce productivity due to lower solar input and oxygen deficiency in saturated soils.
Soil nutrient composition (nitrogen, phosphorus, potassium) affects plant growth; exploited soils are often nutrient-poor.
Aquatic NPP
Factors Affecting Aquatic NPP
Marine NPP is highest near coastlines due to nutrient availability and light penetration.
Photosynthesis occurs only in the upper layers of oceans.
Nutrient runoff from land and upwellings from benthic water increase NPP.
Highest NPP is found in coastal regions and areas with nutrient upwelling.
Eutrophication
Impact on Aquatic Ecosystems
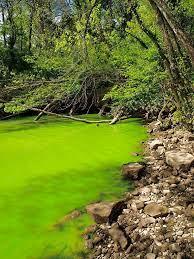
Eutrophication is the process by which water bodies become enriched with nutrients, leading to excessive plant and algal growth.
Caused by nutrient runoff (e.g., fertilizers) into aquatic systems.
Results in algal blooms, reduced oxygen levels, and harm to aquatic life.
Aquatic Zones
Zonation in Lakes and Marine Environments
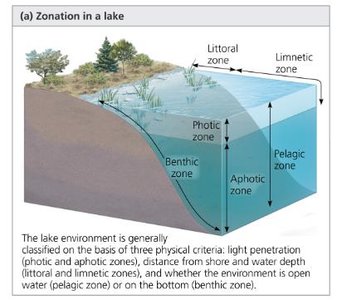
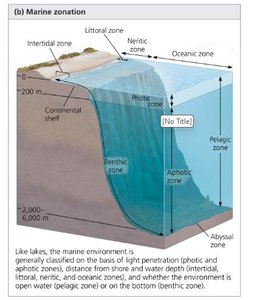
Aquatic environments are classified based on light penetration, distance from shore, and water depth.
Littoral zone: Near shore, shallow, well-lit.
Limnetic zone: Open water, well-lit.
Photic zone: Receives sunlight, supports photosynthesis.
Aphotic zone: No sunlight, limited photosynthesis.
Benthic zone: Bottom of the water body.
Pelagic zone: Open water away from shore.
Water Cycle
Global Water Distribution and Movement
The water cycle describes the continuous movement of water on, above, and below the surface of the Earth.
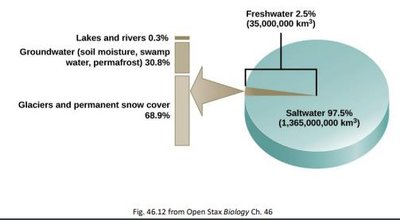
Major reservoirs: Oceans (97.5% of water), glaciers and snow (68.9% of freshwater), groundwater, lakes, rivers.
Processes: Evaporation, condensation, precipitation, infiltration, runoff, transpiration.
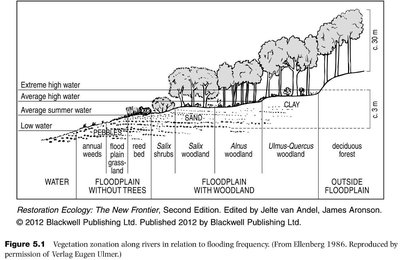
Residence Time of Water Molecules
Water molecules spend varying amounts of time in different reservoirs.
Reservoir | Average Residence Time |
|---|---|
Biospheric (living organisms) | 1 week |
Atmospheric | 1.5 weeks |
Rivers | 2 weeks |
Soil moisture | 2 weeks–1 year |
Swamps | 1–10 years |
Lakes & reservoirs | 10 years |
Oceans & seas | 4,000 years |
Groundwater | 2 weeks–10,000 years |
Glaciers & permafrost | 1,000–10,000 years |
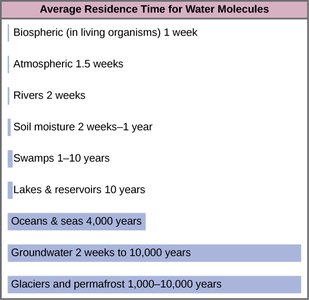
Vegetation Zonation
Vegetation Along Rivers and Floodplains
Vegetation zonation describes how plant communities change along environmental gradients, such as flooding frequency.
Floodplain vegetation varies with water level and soil type.
Different plant species dominate areas with varying flooding and soil composition.
Soil
Factors Regulating Soil Character
Soil properties are determined by multiple factors, which influence plant growth and ecosystem productivity.
Topography: Landscape features affect drainage and erosion.
Parent material: The original rock or organic material from which soil forms.
Age of soil: Older soils may be more weathered and nutrient-poor.
Soil organisms & plants: Influence decomposition and nutrient cycling.
Climate: Temperature and precipitation affect soil formation.
Human activity: Agriculture, pollution, and land use impact soil quality.
Cation Exchange Capacity (CEC)
Soil particles are negatively charged and deliver positively charged cations (Ca2+, K+, Na+, NH4+, Mg2+) to plants.
Cation Exchange Capacity (CEC): The ability of soil to hold and exchange cations, which is crucial for plant nutrition.
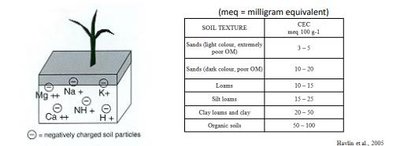
Soil Texture | CEC (meq/100g) |
|---|---|
Sand (light color, poor OM) | 3–5 |
Sand (dark color, poor OM) | 10–30 |
Loams | 10–15 |
Silt loams | 15–25 |
Clay loams and clay | 20–35 |
Organic soils | 50–100 |
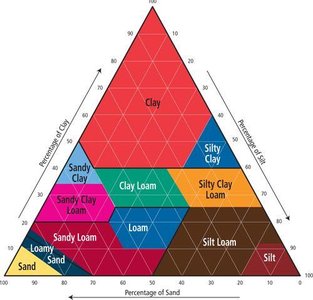
Soil Texture Classification
Soil texture is classified based on the proportions of sand, silt, and clay.
Different textures affect water retention, nutrient availability, and plant growth.
Loam is considered ideal for most plants due to balanced properties.
Summary
These notes cover key concepts in ecosystem ecology, including trophic levels, energy transfer, nutrient cycles, NPP, aquatic zones, water cycle, vegetation zonation, and soil properties. Understanding these topics is essential for analyzing ecosystem structure, function, and sustainability.
