 뒤로
뒤로Foundations of Data Collection and Sampling in Business Statistics
스터디 가이드 - 스마트 노트
 자료에 맞춘 맞춤형 노트, 핵심 정의, 예시, 맥락을 확장해 제공합니다.
Data Collection
Planning the Study
Data collection is the process of gathering and recording information to answer a specific research question. It is the first step in the process of statistical analysis, followed by organizing and interpreting the data.
Collect: Gather and record information relevant to the research question.
Analyse: Organize and examine the collected data.
Interpret: Explain what the results reveal about the research question.
Before collecting data, clearly define:
Who: The population or group to be studied (e.g., first-year students at a campus).
What: The variables or characteristics to be measured (e.g., travel mode, journey time, comfort).
Which: The specific instance or event to be recorded (e.g., the most recent trip to campus).
Sources and Methods of Data Collection
Primary Data: Collected specifically for the current study (e.g., surveys).
Secondary Data: Previously collected data reused for the current study (e.g., existing records).
Common approaches to data collection include:
Survey: Asking people questions via questionnaires (self-completed or interviewer-led).
Direct Observation: Observing, counting, or measuring events as they occur.
Experiment: Assigning conditions and recording outcomes.
Existing Records: Using previously recorded information.
Data and Variables
Data Records and Structure
Data are organized into records, with each row typically representing one unit (e.g., a student) and each column representing a variable (e.g., travel mode, journey time, comfort).
Unit: The person or object studied.
Variable: A characteristic recorded for each unit.
Observation: One row of values for a unit.
Dataset: The complete collection of records.
Data can be:
Structured: Organized into predefined fields (e.g., tables).
Unstructured: Not organized into predefined fields (e.g., free-text comments).
Types of Data: Cross-Sectional, Time-Series, and Panel Data
Data can be classified based on how observations are collected:
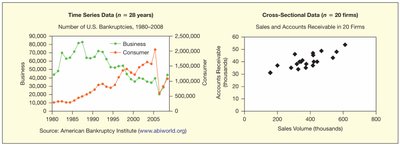
Cross-sectional data: Observations from different units at the same point in time.
Time-series data: Observations from the same unit at different points in time.
Panel data: Repeated observations of the same units over time.
Types of Variables
Categorical (Qualitative): Describes a category or group (e.g., travel mode).
Numerical (Quantitative): Describes an amount counted or measured (e.g., journey time).
Numerical variables can be further classified as:
Discrete: Takes on distinct, separate values (e.g., number of visits).
Continuous: Can take any value within an interval (e.g., journey duration in minutes).
Scales of Measurement
Four Scales of Measurement
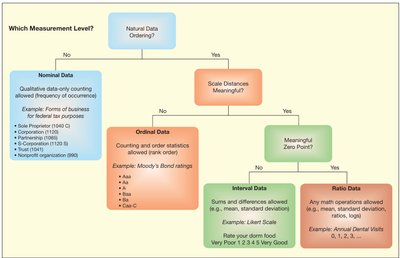
The scale of measurement determines which comparisons and statistical analyses are appropriate for a variable:
Nominal: Categories with no natural order (e.g., travel mode).
Ordinal: Categories with a natural order but unequal intervals (e.g., comfort level).
Interval: Numerical scale with equal intervals but no true zero (e.g., temperature in Celsius).
Ratio: Numerical scale with equal intervals and a true zero (e.g., journey duration).
Sampling
Population, Sample, Parameter, and Statistic
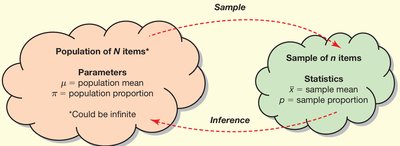
In statistics, we often study a sample to make inferences about a population:
Population: The entire group of interest.
Sample: A subset of the population selected for study.
Parameter: A numerical summary of the population (e.g., population mean ).
Statistic: A numerical summary calculated from the sample (e.g., sample mean ).
Sampling Frame and Methods
Sampling Frame: The list or procedure used to identify population members for selection.
Probability Sampling: Every population member has a known, nonzero chance of selection (e.g., simple random sampling).
Nonprobability Sampling: Selection is not based on known probabilities (e.g., convenience sampling).
Common probability sampling methods include:
Simple Random Sampling: Every possible sample of a given size has the same chance of selection.
Systematic Sampling: Select every k-th unit after a random start.
Stratified Sampling: Divide the population into strata and randomly sample within each stratum.
Cluster Sampling: Divide the population into clusters, randomly select clusters, and include all units in selected clusters.
Sampling Error and Bias
Sampling Error: The difference between a sample estimate and the population value due to random selection.
Bias: A systematic tendency to overestimate or underestimate a population value due to flaws in the sampling method.
Sources of bias include incomplete coverage, nonresponse, and poorly worded questions.
Data Quality
Checking Data Quality
Key aspects to check for data quality include:
Accuracy: Are the recorded values correct?
Completeness: Are all needed values present?
Consistency: Are labels and units used consistently?
Timeliness: Do the data cover the required period and arrive when needed?
Uniqueness: Is each unit recorded only once?
Validity: Do entries follow the stated rules?
Planning a Data Collection Study
Steps to plan a small data collection study:
Define the population and choose relevant variables.
Select an appropriate sampling method and data collection approach.
Write clear questions for each variable.
Describe at least one data-quality check.
Example: To study difficulties faced by first-year students when traveling to campus, use simple random sampling, a survey questionnaire, and check that journey times are non-negative numbers.
