The accompanying graph shows plots of ln k versus 1>T for two different reactions. The plots have been extrapolated to the y-intercepts. Which reaction (red or blue) has (b) the larger value for the frequency factor, A? [Section 14.5]
Ch.14 - Chemical Kinetics
14장, 문제 8a
Which of the following linear plots do you expect for a reaction A¡products if the kinetics are (a) zero order, [Section 14.4]
![Four graphs showing plots of 1/[X], ln[X], and [X] over time for different reaction orders.](https://lightcat-files.s3.amazonaws.com/problem_images/fe3831e00d552752-1666282854514.jpg)
검증된 단계별 안내1
Identify the order of the reaction. For a zero-order reaction, the rate of reaction is independent of the concentration of the reactant.
Recall that for a zero-order reaction, the concentration of the reactant [A] decreases linearly over time.
Understand that the integrated rate law for a zero-order reaction is [A] = [A]_0 - kt, where [A]_0 is the initial concentration and k is the rate constant.
Recognize that a plot of [A] versus time will yield a straight line with a negative slope for a zero-order reaction.
Compare the given plots: Plot D shows [X] (which can be considered as [A]) versus time as a straight line, indicating a zero-order reaction.

비슷한 문제에 대한 검증된 영상 답변:
이 영상 해법은 위 문제에 도움이 된다고 튜터들이 추천한 것입니다.
영상 길이:
1m주요 개념
질문에 올바르게 답하기 위해 반드시 이해해야 하는 핵심 개념들은 다음과 같습니다.
Zero-Order Kinetics
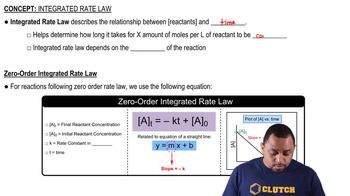
In zero-order kinetics, the rate of reaction is constant and independent of the concentration of the reactant. This means that the reaction proceeds at a steady rate until the reactant is depleted. The concentration of the reactant decreases linearly over time, leading to a plot of [A] versus time that is a straight line.
추천 영상:
가이드 코스
Zero-Order Reactions
Integrated Rate Laws
Integrated rate laws relate the concentration of reactants to time for different orders of reactions. For zero-order reactions, the integrated rate law is [A] = [A]₀ - kt, where [A]₀ is the initial concentration, k is the rate constant, and t is time. This equation indicates that a plot of [A] versus time will yield a straight line, confirming zero-order behavior.
추천 영상:
가이드 코스
Rate Law Fundamentals
Graphical Representation of Reaction Orders
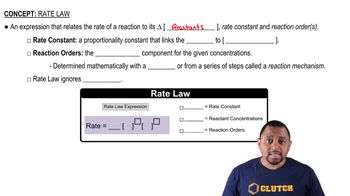
Different reaction orders produce distinct graphical representations when plotting concentration versus time or its transformations. For zero-order reactions, a plot of [A] versus time is linear, while plots of 1/[A] or ln[A] versus time are not linear. Understanding these graphical representations is crucial for identifying the order of a reaction based on experimental data.
추천 영상:
가이드 코스
Zero-Order Reactions
관련 실천
교과서 질문
780
views
교과서 질문
The following diagrams represent mixtures of NO(g) and O21g2. These two substances react as follows: 2 NO1g2 + O21g2¡2 NO21g2 It has been determined experimentally that the rate is second order in NO and first order in O2. Based on this fact, which of the following mixtures will have the fastest initial rate? [Section 14.3]
748
views
교과서 질문
Given the following diagrams at t = 0 min and t = 30 min
After four half-life periods for a first-order reaction, what fraction of reactant remains? [Section 14.4]
997
views
1
rank
1
comments
교과서 질문
The accompanying graph shows plots of ln k versus 1>T for two different reactions. The plots have been extrapolated to the y-intercepts. Which reaction (red or blue) has (a) the larger value for Ea,
706
views