In the citric acid cycle, an enzyme oxidizes malate to oxaloacetate, with the production of NADH and the release of H+. You are studying this reaction using a suspension of bean cell mitochondria and a blue dye that loses its color as it takes up H+. You set up reaction mixtures with mitochondria, dye, and three different concentrations of malate (0.1 mg/L, 0.2 mg/L, and 0.3 mg/L). Which of the following graphs represents the results you would expect, and why?
검증된 단계별 안내
1
Step 1: Understand the reaction: Malate is oxidized to oxaloacetate, producing NADH and releasing H+. The blue dye loses its color as it takes up H+.
Step 2: Identify the relationship between malate concentration and the rate of reaction: Higher malate concentration should result in a faster reaction rate, leading to more H+ release and faster color loss of the dye.
Step 3: Analyze the graphs: Look for the graph where higher malate concentrations (0.3 mg/L) result in a faster decrease in color intensity over time.
Step 4: Compare the graphs: Graph (a) shows increasing color intensity, which is incorrect. Graph (b) shows decreasing color intensity, but the lines converge, which is not expected. Graph (c) shows decreasing color intensity with the steepest slope for the highest malate concentration (0.3 mg/L), which matches our expectations.
Step 5: Conclude that graph (c) represents the expected results because it shows the fastest color loss for the highest malate concentration, indicating the highest rate of H+ release and dye decolorization.
비슷한 문제에 대한 검증된 영상 답변:
이 영상 해법은 위 문제에 도움이 된다고 튜터들이 추천한 것입니다.
영상 길이:
3m
영상 재생:
0 댓글
주요 개념
질문에 올바르게 답하기 위해 반드시 이해해야 하는 핵심 개념들은 다음과 같습니다.
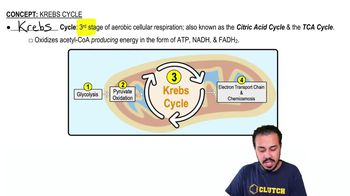
Citric Acid Cycle
The citric acid cycle, also known as the Krebs cycle, is a series of enzymatic reactions that occur in the mitochondria, where acetyl-CoA is oxidized to produce energy. Key products include NADH, FADH2, and ATP, which are essential for cellular respiration. Understanding this cycle is crucial for analyzing how substrates like malate are metabolized and how energy is generated in cells.
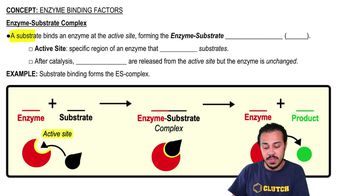
Enzyme activity is influenced by substrate concentration, typically following Michaelis-Menten kinetics. As substrate concentration increases, the rate of reaction increases until it reaches a maximum velocity (Vmax) when all enzyme active sites are saturated. This concept is vital for predicting how varying concentrations of malate will affect the rate of the reaction and the production of NADH in the experiment.
Colorimetric analysis involves measuring the intensity of color change in a solution, which can indicate the concentration of a substance. In this experiment, a blue dye that loses color as it takes up H+ is used to monitor the reaction's progress. Understanding how color intensity correlates with the reaction rate allows for the interpretation of the results and the expected graph shapes based on malate concentrations.

 3:10분
3:10분
 검증된 단계별 안내
 01:37
01:37