 뒤로
뒤로Chapter 20: Phylogeny – Understanding Evolutionary Relationships
스터디 가이드 - 스마트 노트
 자료에 맞춘 맞춤형 노트, 핵심 정의, 예시, 맥락을 확장해 제공합니다.
Phylogeny: Investigating the Evolutionary History of Life
Introduction to Phylogeny
Phylogeny is the study of the evolutionary history and relationships among species or groups of related species. Systematics is the scientific discipline that classifies organisms and determines their evolutionary relationships, often using phylogenetic trees as visual representations.
Phylogeny: The evolutionary history of a species or group of related species.
Systematics: The study of biological diversity in an evolutionary context, encompassing taxonomy and phylogeny.
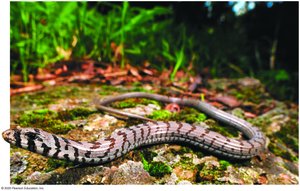
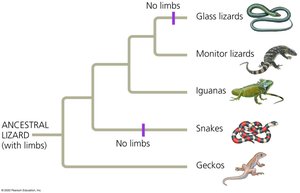
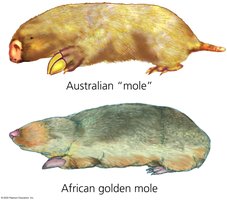
Convergent evolution: The independent evolution of similar features in different lineages, often due to adaptation to similar environments.
Concept 20.1: Phylogenies Show Evolutionary Relationships
Taxonomy and Classification
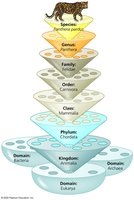
Taxonomy is the ordered division and naming of organisms. The Linnaean system, developed by Carolus Linnaeus, introduced binomial nomenclature and a hierarchical classification system.
Binomial nomenclature: Each species is given a two-part scientific name (Genus species), e.g., Panthera pardus.
Hierarchical classification: Species are grouped into increasingly broad categories: species, genus, family, order, class, phylum, kingdom, and domain.
Taxon: Any named group at any level of the hierarchy.
Linking Classification and Phylogeny
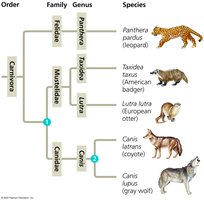
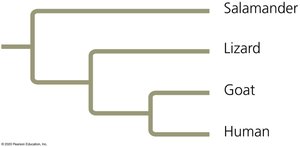
Phylogenetic trees are branching diagrams that represent hypotheses about evolutionary relationships. The branching pattern often reflects how taxonomists classify groups within more inclusive groups.
Understanding Phylogenetic Trees
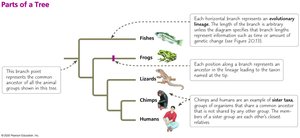
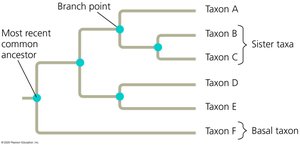
Each branch point (node) represents the divergence of two evolutionary lineages from a common ancestor.
Sister taxa are groups that share an immediate common ancestor.
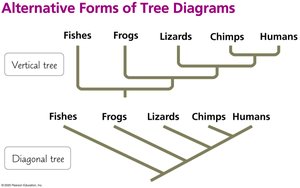
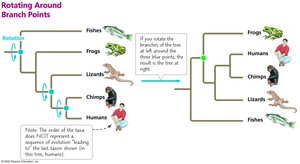
Phylogenetic trees can be drawn in various orientations without changing the relationships depicted.
The order of taxa at the tips does not indicate the sequence of evolution.
A rooted tree includes a branch representing the most recent common ancestor of all taxa in the tree.
A basal taxon diverges early in the history of a group and lies on a branch that originates near the common ancestor.
Applications of Phylogenies
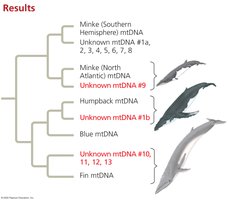
Phylogenetic trees based on DNA sequences can be used to infer species identities and evolutionary relationships, such as identifying the source species of whale meat.
Concept 20.2: Phylogenies Are Inferred from Morphological and Molecular Data
Homology vs. Analogy
Phylogenies are inferred from similarities in morphology, genetics, and biochemistry. Only similarities resulting from common ancestry (homologies) reflect evolutionary relationships.
Homology: Similarity due to shared ancestry.
Analogy: Similarity due to convergent evolution, not common ancestry.
Evaluating Molecular Homologies
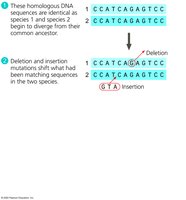
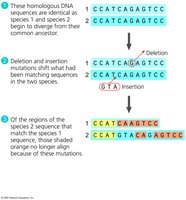
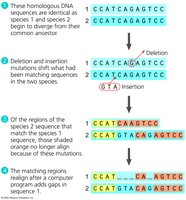
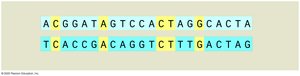
Molecular homologies are based on the degree of similarity in nucleotide sequences. Insertions or deletions can shift sequences, causing mismatches. Computer programs help align sequences and identify homologies.
Concept 20.3: Shared Characters Are Used to Construct Phylogenetic Trees
Cladistics and Clades
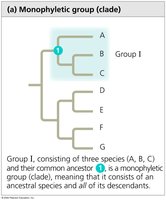
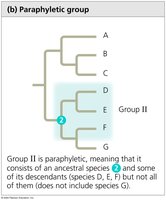
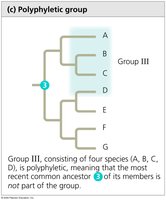
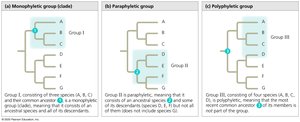
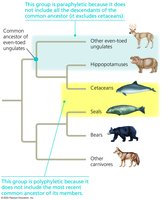
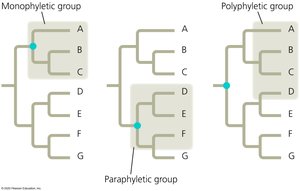
Cladistics classifies organisms by common descent. A clade is a group of species that includes an ancestral species and all its descendants. Clades can be nested, but not all groupings are clades.
Monophyletic group (clade): Includes ancestor and all descendants.
Paraphyletic group: Includes ancestor and some, but not all, descendants.
Polyphyletic group: Includes distantly related species but not their most recent common ancestor.
Shared Ancestral and Shared Derived Characters
Shared ancestral character: Originated in an ancestor of the taxon.
Shared derived character: Evolutionary novelty unique to a particular clade.
The same character can be ancestral or derived depending on the context.
Inferring Phylogenies Using Derived Characters
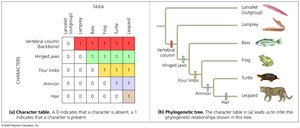
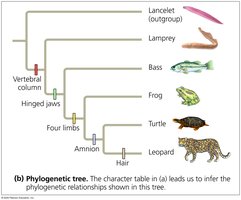
Determining when shared derived characters first appeared helps infer evolutionary relationships. An ingroup is the group being studied; an outgroup is closely related but not part of the ingroup. Characters found in both are assumed ancestral.
Maximum Parsimony
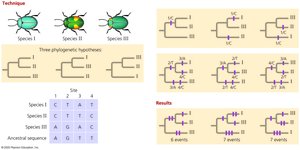
The principle of maximum parsimony states that the simplest explanation (fewest evolutionary events) is most likely. Computer programs are used to find the most parsimonious tree.
Phylogenetic Trees as Hypotheses
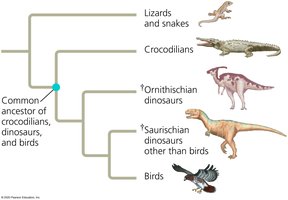
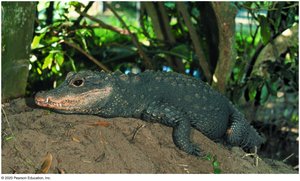
Phylogenetic trees are hypotheses that are revised as new data arise. Phylogenetic bracketing predicts features of ancestors and extinct descendants based on living relatives.
Concept 20.4: Molecular Clocks Help Track Evolutionary Time
Molecular Clocks
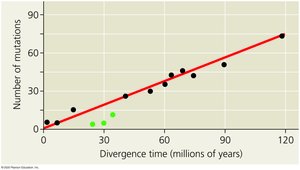
A molecular clock uses the constant rate of evolution in some genes to estimate the timing of evolutionary events. The number of nucleotide substitutions is assumed proportional to the time since divergence.
Molecular clocks are calibrated using fossil record data.
Not all genes evolve at the same rate; some are more clocklike than others.
Neutral mutations accumulate at a regular rate, while critical genes evolve more slowly.
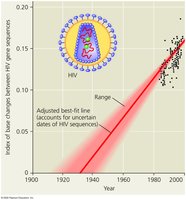
Concept 20.5: New Information Continues to Revise Our Understanding of Evolutionary History
From Two Kingdoms to Three Domains
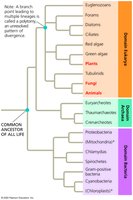
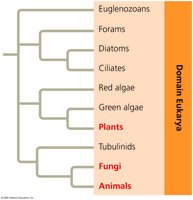
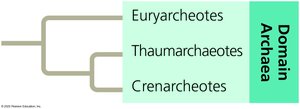
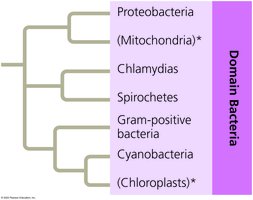
Classification systems have evolved from two kingdoms (plants and animals) to five kingdoms, and now to three domains: Bacteria, Archaea, and Eukarya. The three-domain system is supported by genetic data and highlights the importance of single-celled organisms.
Horizontal Gene Transfer
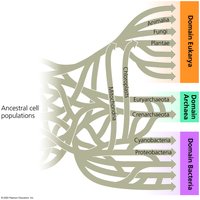
Horizontal gene transfer is the movement of genes between different species, often through plasmids, viruses, or fusion of organisms. This process was common in early life and complicates the reconstruction of evolutionary history, making the tree of life more like a web.
Tables and Data Interpretation
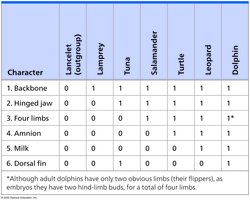
Character Table Example
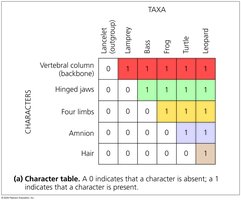
Character tables are used to infer phylogenetic relationships by comparing the presence or absence of traits among taxa.
Character | Lancelet (outgroup) | Lamprey | Bass | Frog | Turtle | Leopard |
|---|---|---|---|---|---|---|
Vertebral column | 0 | 1 | 1 | 1 | 1 | 1 |
Hinged jaws | 0 | 0 | 1 | 1 | 1 | 1 |
Four limbs | 0 | 0 | 0 | 1 | 1 | 1 |
Amnion | 0 | 0 | 0 | 0 | 1 | 1 |
Hair | 0 | 0 | 0 | 0 | 0 | 1 |
Key: 0 = character absent, 1 = character present.
Summary
Phylogeny and systematics are essential for understanding evolutionary relationships.
Classification systems have evolved with new data, especially molecular evidence.
Phylogenetic trees are hypotheses, revised as new evidence emerges.
Horizontal gene transfer complicates the tree of life, making it more web-like.
