목차
- 1. Introduction to Statistics
- 2. Describing Data with Tables and Graphs
- 3. Describing Data Numerically
- 4. Probability
- 5. Binomial Distribution & Discrete Random Variables
- 6. Normal Distribution & Continuous Random Variables
- 7. Sampling Distributions & Confidence Intervals: Mean
- Sampling Distribution of the Sample Mean and Central Limit Theorem
- Distribution of Sample Mean - ExcelBonus
- Introduction to Confidence Intervals
- Confidence Intervals for Population Mean
- Determining the Minimum Sample Size Required
- Finding Probabilities and T Critical Values - ExcelBonus
- Confidence Intervals for Population Means - ExcelBonus
- 8. Sampling Distributions & Confidence Intervals: Proportion
- 9. Hypothesis Testing for One Sample
- Steps in Hypothesis Testing
- Performing Hypothesis Tests: Means
- Hypothesis Testing: Means - ExcelBonus
- Performing Hypothesis Tests: Proportions
- Hypothesis Testing: Proportions - ExcelBonus
- Performing Hypothesis Tests: Variance
- Critical Values and Rejection Regions
- Link Between Confidence Intervals and Hypothesis Testing
- Type I & Type II Errors
- 10. Hypothesis Testing for Two Samples
- Two Proportions
- Two Proportions Hypothesis Test - ExcelBonus
- Two Means - Unknown, Unequal Variance
- Two Means - Unknown Variances Hypothesis Test - ExcelBonus
- Two Means - Unknown, Equal Variance
- Two Means - Unknown, Equal Variances Hypothesis Test - ExcelBonus
- Two Means - Known Variance
- Two Means - Sigma Known Hypothesis Test - ExcelBonus
- Two Means - Matched Pairs (Dependent Samples)
- Matched Pairs Hypothesis Test - ExcelBonus
- Two Variances and F Distribution
- Two Variances - Graphing CalculatorBonus
- 11. Correlation
- 12. Regression
- Linear Regression & Least Squares Method
- Residuals
- Coefficient of Determination
- Regression Line Equation and Coefficient of Determination - ExcelBonus
- Finding Residuals and Creating Residual Plots - ExcelBonus
- Inferences for Slope
- Enabling Data Analysis ToolpakBonus
- Regression Readout of the Data Analysis Toolpak - ExcelBonus
- Prediction Intervals
- Prediction Intervals - ExcelBonus
- Multiple Regression - ExcelBonus
- Quadratic Regression
- Quadratic Regression - ExcelBonus
- 13. Chi-Square Tests & Goodness of Fit
- 14. ANOVA
14. ANOVA
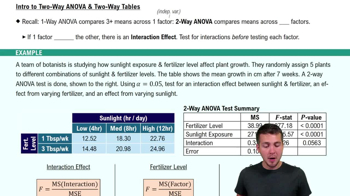
Two-Way ANOVA
14. ANOVA
Two-Way ANOVA
 08:17
08:17

이 주제를 연습하세요
- 객관식
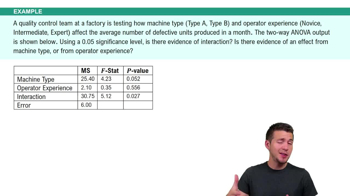
Which of the following scenarios can be appropriately answered using a Two-Way ANOVA test?
137views1rank - 객관식
A university surveys how study group size (solo, duo, group) and study environment (quiet, noisy) affect test performance. Which of the following conclusions most clearly suggests an interaction effect between the two factors?
115views - 객관식
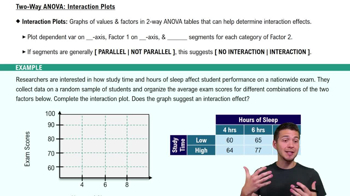
Which of the following interaction plots best indicates no interaction between the two factors?
151views