Skip to main content
Statistics for Business
나의 코스
배우기
시험 준비
AI 튜터
학습 가이드
플래시카드
탐험해 보세요
앱을 사용해 보세요
나의 코스
배우기
시험 준비
AI 튜터
학습 가이드
플래시카드
탐험해 보세요
앱을 사용해 보세요
뒤로
Percentiles & Quartiles quiz
카드를 뒤집기 위해 탭할 수 있습니다.
What is a percentile in statistics?
카드를 뒤집기 위해 탭할 수 있습니다.
👆
What is a percentile in statistics?
A percentile is a measure that indicates the value below which a given percentage of observations in a dataset falls.
진행 상황 추적
컨트롤 버튼이 '내비게이션' 모드로 변경되었습니다.
1/15
관련 플래시카드
관련 실천
추천 영상
Percentiles & Quartiles definitions
Percentiles & Quartiles
12 용어
Percentiles & Quartiles
3. Describing Data Numerically
10 문제점
주제
Jonathan
5-Number Summary Using a TI-84
3. Describing Data Numerically
10 문제점
주제
3. Describing Data Numerically
8 주제
19 문제점
장
Jonathan
VideoThumbView.guidedCourse
07:11
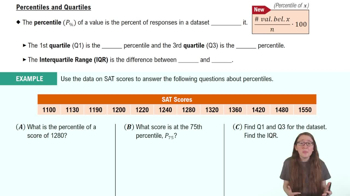
Percentiles and Quartiles
425
views
2
rank
VideoThumbView.guidedCourse
04:30
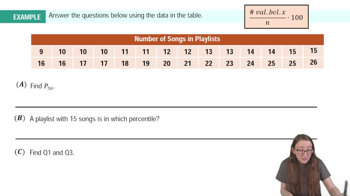
Percentiles and Quartiles Example 1
245
views
4
rank
이 집합의 용어 (15)
하이드의 정의
What is a percentile in statistics?
A percentile is a measure that indicates the value below which a given percentage of observations in a dataset falls.
How is the 25th percentile also known?
The 25th percentile is also known as the first quartile (Q1).
What does the 50th percentile represent?
The 50th percentile represents the median of the dataset.
What is the third quartile (Q3)?
The third quartile (Q3) is the value below which 75% of the data falls.
How are quartiles related to percentiles?
Quartiles are specific percentiles: Q1 is the 25th, Q2 is the 50th, and Q3 is the 75th percentile.
What is the interquartile range (IQR)?
The interquartile range (IQR) is the difference between the third quartile (Q3) and the first quartile (Q1).
How do you calculate a percentile rank?
Percentile rank is calculated by determining the percentage of values in the dataset that are less than a particular value.
What is the purpose of using percentiles in data analysis?
Percentiles help to understand the relative standing of a value within a dataset.
How many quartiles are there in a dataset?
There are three quartiles: Q1, Q2, and Q3.
What does the first quartile (Q1) indicate?
Q1 indicates the value below which 25% of the data falls.
What is the formula for the interquartile range?
The formula for IQR is IQR = Q3 - Q1.
Why are quartiles useful in statistics?
Quartiles are useful for summarizing the spread and central tendency of a dataset.
What is the difference between a percentile and a quartile?
A percentile divides data into 100 equal parts, while a quartile divides data into four equal parts.
How can percentiles be used to compare scores?
Percentiles allow comparison of scores by showing the percentage of scores below a particular value.
What is the median in terms of quartiles?
The median is the second quartile (Q2), or the 50th percentile.
 뒤로뒤로
뒤로뒤로
 07:11
07:11