Ch. 2 - Limits
Briggs - Calculus: Early Transcendentals 3rd Edition
Briggs3rd EditionCalculus: Early TranscendentalsISBN: 9780136847243당신이 사용하는 게 아니라요?교과서 변경
2장, 문제 2.12a

Graph the function f(x)=e^−x / x(x+2)^2 using a graphing utility. (Experiment with your choice of a graphing window.) Use your graph to determine the following limits.


a. lim x→−2^+ f(x)

검증된 단계별 안내
1
Step 1: Understand the function and its components. The function is \( f(x) = \frac{e^{-x}}{x(x+2)^2} \). It is a rational function with an exponential term in the numerator and a polynomial in the denominator.
Step 2: Identify the point of interest for the limit, which is \( x \to -2^+ \). This means we are approaching \( x = -2 \) from the right side.
Step 3: Analyze the behavior of the denominator as \( x \to -2^+ \). The term \((x+2)^2\) in the denominator approaches zero, which suggests a vertical asymptote at \( x = -2 \).
Step 4: Consider the behavior of the numerator, \( e^{-x} \), as \( x \to -2^+ \). Since \( e^{-x} \) is continuous and positive for all real \( x \), it does not approach zero or infinity.
Step 5: Use a graphing utility to visualize the function \( f(x) \) and observe the behavior as \( x \to -2^+ \). The graph will help confirm whether the limit approaches positive or negative infinity.

비슷한 문제에 대한 검증된 영상 답변:

이 영상 해법은 위 문제에 도움이 된다고 튜터들이 추천한 것입니다.
영상 길이:
1m
도움이 되었나요?

주요 개념

질문에 올바르게 답하기 위해 반드시 이해해야 하는 핵심 개념들은 다음과 같습니다.

Limits

Limits are fundamental in calculus, representing the value that a function approaches as the input approaches a certain point. In this context, evaluating the limit as x approaches -2 from the right (denoted as -2^+) involves analyzing the behavior of the function f(x) near that point, which can reveal important characteristics such as continuity and potential asymptotes.
추천 영상:
05:50
One-Sided Limits

Graphing Functions

Graphing functions involves plotting the values of a function on a coordinate system to visualize its behavior. For the function f(x) = e^(-x) / (x(x+2)^2), using a graphing utility allows for experimentation with different viewing windows, which can help identify key features such as intercepts, asymptotes, and the overall shape of the graph, aiding in the limit evaluation.
추천 영상:
5:53
Graph of Sine and Cosine Function

Asymptotic Behavior

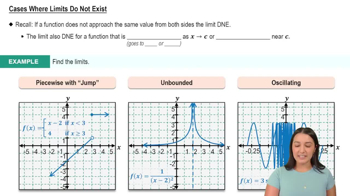
Asymptotic behavior refers to how a function behaves as it approaches a certain point or infinity. In the case of f(x) as x approaches -2, understanding whether the function approaches a finite value, diverges to infinity, or oscillates is crucial for determining the limit. This behavior can often be inferred from the graph and the function's algebraic form.
추천 영상:
03:07
Cases Where Limits Do Not Exist