Ch. 5 - Integration
Briggs - Calculus: Early Transcendentals 3rd Edition
Briggs3rd EditionCalculus: Early TranscendentalsISBN: 9780136847243당신이 사용하는 게 아니라요?교과서 변경
5장, 문제 5.1.71a

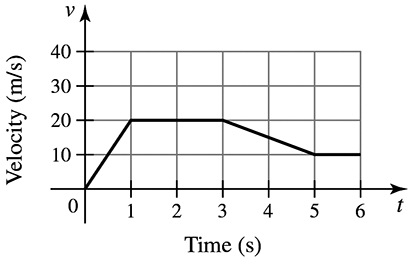
Displacement from a velocity graph Consider the velocity function for an object moving along a line (see figure).
(a) Describe the motion of the object over the interval [0,6].
Graph showing velocity in m/s over time in seconds, illustrating an object's motion from 0 to 6 seconds.

검증된 단계별 안내
1
Observe the velocity graph, which shows the velocity of the object (in m/s) as a function of time (in seconds). The graph consists of linear segments over the interval [0,6].
From t=0 to t=1, the velocity increases linearly from 0 m/s to 20 m/s. This indicates the object is accelerating uniformly during this time.
From t=1 to t=3, the velocity remains constant at 20 m/s. This indicates the object is moving at a constant velocity, covering equal distances in equal time intervals.
From t=3 to t=5, the velocity decreases linearly from 20 m/s to 10 m/s. This indicates the object is decelerating uniformly during this time.
From t=5 to t=6, the velocity remains constant at 10 m/s. This indicates the object is moving at a constant velocity again, but at a slower speed compared to the interval [1,3].

비슷한 문제에 대한 검증된 영상 답변:

이 영상 해법은 위 문제에 도움이 된다고 튜터들이 추천한 것입니다.
영상 길이:
2m
도움이 되었나요?

주요 개념

질문에 올바르게 답하기 위해 반드시 이해해야 하는 핵심 개념들은 다음과 같습니다.

Velocity

Velocity is a vector quantity that describes the rate of change of an object's position with respect to time. It includes both speed and direction. In the context of the graph, the velocity values indicate how fast the object is moving at different times, which is crucial for understanding its motion.
추천 영상:
가이드 코스
06:29
Derivatives Applied To Velocity

Displacement

Displacement is the overall change in position of an object, calculated as the area under the velocity-time graph. It can be positive, negative, or zero, depending on the direction of motion. By analyzing the graph, one can determine the total displacement over the interval [0,6] seconds by summing the areas of the shapes formed under the curve.
추천 영상:
가이드 코스
10:17
Using The Velocity Function

Intervals of Motion

Intervals of motion refer to specific time segments during which the object's velocity remains constant or changes. In the given graph, different segments indicate periods of acceleration, constant velocity, and deceleration. Understanding these intervals helps in describing the object's motion accurately over the specified time frame.
추천 영상:
가이드 코스
06:29
Derivatives Applied To Velocity
관련 실천
교과서 질문

Zero net area Consider the function ƒ(𝓍) = 𝓍² ― 4𝓍 .

(a) Graph ƒ on the interval 𝓍 ≥ 0.

61
views

교과서 질문

Explain why or why not Determine whether the following statements are true and give an explanation or counterexample. Assume ƒ, ƒ', and ƒ'' are continuous functions for all real numbers.                                                                                                                                                           


(a) ∫ ƒ(𝓍) ƒ'(𝓍) d𝓍 = ½ (ƒ(𝓍))² + C.

44
views
교과서 질문

The velocity in ft/s of an object moving along a line is given by v = ƒ(t) on the interval 0 ≤ t ≤ 6 (see figure), where t is measured in seconds.


(a) Divide the interval [0,6] into n = 3 subintervals, [0,2] , [2,4] and [4,6]. On each subinterval, assume the object moves at a constant velocity equal to the value of v evaluated at the right endpoint of the subinterval, and use these approximations to estimate the displacement of the object on [0,6] (see part (a) of the figure)                                                                                                             


67
views
교과서 질문

Sigma notation Evaluate the following expressions.

(a)    10                                                                                                                                                                               

       ∑ κ                                                                                                                                                                          

       κ=1                         

64
views
교과서 질문

Area functions for constant functions Consider the following functions ƒ and real numbers a (see figure).

(a) Find and graph the area function A(𝓍) = ∫ₐˣ ƒ(t) dt for ƒ.

ƒ(t) = 5 , a = 0

108
views
교과서 질문

Working with area functions Consider the function ƒ and the points a, b, and c.

(a) Find the area function A (𝓍) = ∫ₐˣ ƒ(t) dt using the Fundamental Theorem.

ƒ(𝓍) = sin 𝓍 ; a = 0 , b = π/2 , c = π

51
views