Ch. 2 - Functions and Graphs
Blitzer - College Algebra 8th Edition
Blitzer8th EditionCollege AlgebraISBN: 9780136970514당신이 사용하는 게 아니라요?교과서 변경
3장, 문제 11

Use the graph of y = f(x) to graph each function g.

g(x) = ½ f(x)

검증된 단계별 안내
1
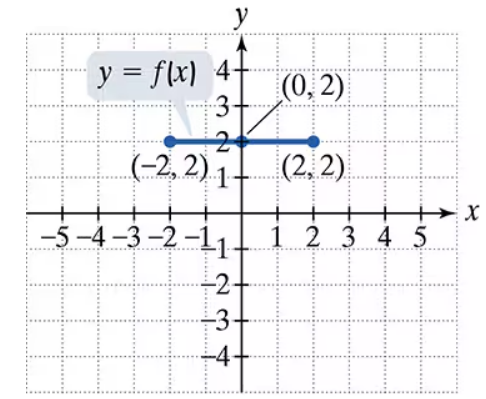
Step 1: Observe the graph of y = f(x). It is a horizontal line segment from (1, -3) to (4, -3). This means that the function f(x) has a constant value of -3 for all x in the interval [1, 4].
Step 2: The new function g(x) = ½ f(x) involves scaling the values of f(x) by a factor of ½. Since f(x) = -3, g(x) = ½ * (-3) = -3/2 for all x in the interval [1, 4].
Step 3: To graph g(x), keep the x-values the same (from 1 to 4), but adjust the y-values to reflect the scaled value of -3/2. This means the new graph will be a horizontal line segment at y = -3/2.
Step 4: Plot the points (1, -3/2) and (4, -3/2) on the graph. These points represent the endpoints of the horizontal line segment for g(x).
Step 5: Draw a horizontal line segment connecting the points (1, -3/2) and (4, -3/2). This is the graph of g(x) = ½ f(x).

비슷한 문제에 대한 검증된 영상 답변:

이 영상 해법은 위 문제에 도움이 된다고 튜터들이 추천한 것입니다.
영상 길이:
1m
도움이 되었나요?

주요 개념

질문에 올바르게 답하기 위해 반드시 이해해야 하는 핵심 개념들은 다음과 같습니다.

Function Transformation

Function transformation refers to the process of altering the graph of a function through operations such as scaling, translating, or reflecting. In this case, the function g(x) = ½ f(x) represents a vertical compression of the function f(x) by a factor of ½, meaning that all y-values of f(x) are halved, resulting in a graph that is closer to the x-axis.
추천 영상:
4:22
Domain & Range of Transformed Functions

Graphing Linear Functions

Graphing linear functions involves plotting points that satisfy the function's equation and connecting them to form a straight line. For the function f(x) shown in the graph, which is a horizontal line at y = -3 between x = 1 and x = 4, understanding how to plot these points is essential for accurately representing the transformed function g(x).
추천 영상:
5:26
Graphs of Logarithmic Functions

Horizontal and Vertical Scaling

Horizontal and vertical scaling are techniques used to stretch or compress the graph of a function. Vertical scaling, as seen in g(x) = ½ f(x), compresses the graph vertically, affecting the y-values while keeping the x-values unchanged. This concept is crucial for predicting how the graph of g will appear compared to f.
추천 영상:
5:28
Horizontal Parabolas