Ch. 2 - Functions and Graphs
Blitzer - College Algebra 8th Edition
Blitzer8th EditionCollege AlgebraISBN: 9780136970514당신이 사용하는 게 아니라요?교과서 변경
3장, 문제 39

Graph the given functions, f and g, in the same rectangular coordinate system. Select integers for x, starting with -2 and ending with 2. Once you have obtained your graphs, describe how the graph of g is related to the graph of f. f(x) = x, g(x) = x + 3

검증된 단계별 안내
1
Identify the given functions: \(f(x) = x\) and \(g(x) = x + 3\).
Create a table of values for \(x\) starting from \(-2\) to \(2\). For each \(x\), calculate \(f(x)\) and \(g(x)\) separately.
For \(f(x) = x\), the values will be the same as \(x\) itself. For \(g(x) = x + 3\), add 3 to each \(x\) value to find the corresponding \(g(x)\) values.
Plot the points for both functions on the same coordinate system using the calculated values. For example, plot \((x, f(x))\) and \((x, g(x))\) for each \(x\) from \(-2\) to \(2\).
Observe the graphs: describe how the graph of \(g\) is related to the graph of \(f\). Consider how adding 3 to \(x\) affects the position of the graph compared to \(f(x)\).

비슷한 문제에 대한 검증된 영상 답변:

이 영상 해법은 위 문제에 도움이 된다고 튜터들이 추천한 것입니다.
영상 길이:
8m
도움이 되었나요?

주요 개념

질문에 올바르게 답하기 위해 반드시 이해해야 하는 핵심 개념들은 다음과 같습니다.

Function Notation and Evaluation

Function notation, such as f(x) and g(x), represents a rule that assigns each input x to exactly one output. Evaluating a function means substituting a specific value for x to find the corresponding output, which is essential for plotting points on a graph.
추천 영상:
4:26
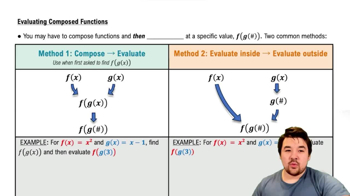
Evaluating Composed Functions

Graphing Linear Functions

Linear functions like f(x) = x produce straight-line graphs. Plotting points for selected x-values and connecting them helps visualize the function. Understanding the slope and intercept aids in sketching and comparing graphs.
추천 영상:
5:26
Graphs of Logarithmic Functions

Vertical Translation of Graphs

Adding a constant to a function, as in g(x) = x + 3, shifts the graph vertically. Specifically, g(x) is the graph of f(x) moved up by 3 units. Recognizing this transformation helps describe the relationship between the two graphs.
추천 영상:
3:12
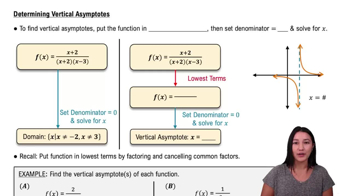
Determining Vertical Asymptotes