Ch. 2 - Functions and Graphs
Blitzer - College Algebra 8th Edition
Blitzer8th EditionCollege AlgebraISBN: 9780136970514당신이 사용하는 게 아니라요?교과서 변경
3장, 문제 59

Use the vertical line test to identify graphs in which y is a function of x.

검증된 단계별 안내
1
Recall that the vertical line test is used to determine if a graph represents a function. According to this test, if any vertical line intersects the graph at more than one point, then the graph does not represent y as a function of x.
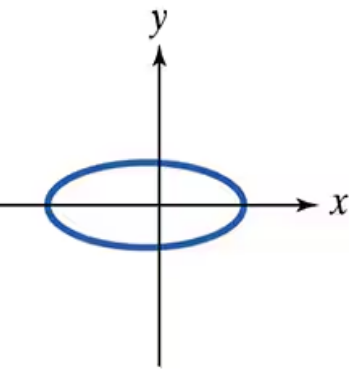
Observe the given graph, which is an oval shape (an ellipse) centered roughly around (-5, 5) on the coordinate plane.
Imagine drawing vertical lines (lines parallel to the y-axis) at various x-values across the graph. Notice that for many x-values within the range of the oval, the vertical line will intersect the oval at two points: one on the upper half and one on the lower half of the oval.
Since there are vertical lines that intersect the graph at more than one point, this means that for some x-values, there are multiple corresponding y-values.
Therefore, based on the vertical line test, the graph does not represent y as a function of x.

비슷한 문제에 대한 검증된 영상 답변:

이 영상 해법은 위 문제에 도움이 된다고 튜터들이 추천한 것입니다.
영상 길이:
45s
도움이 되었나요?

주요 개념

질문에 올바르게 답하기 위해 반드시 이해해야 하는 핵심 개념들은 다음과 같습니다.

Vertical Line Test

The vertical line test is a method used to determine if a graph represents a function. If any vertical line drawn through the graph intersects it at more than one point, the graph does not represent a function because a single input (x-value) corresponds to multiple outputs (y-values).
추천 영상:
가이드 코스
06:49
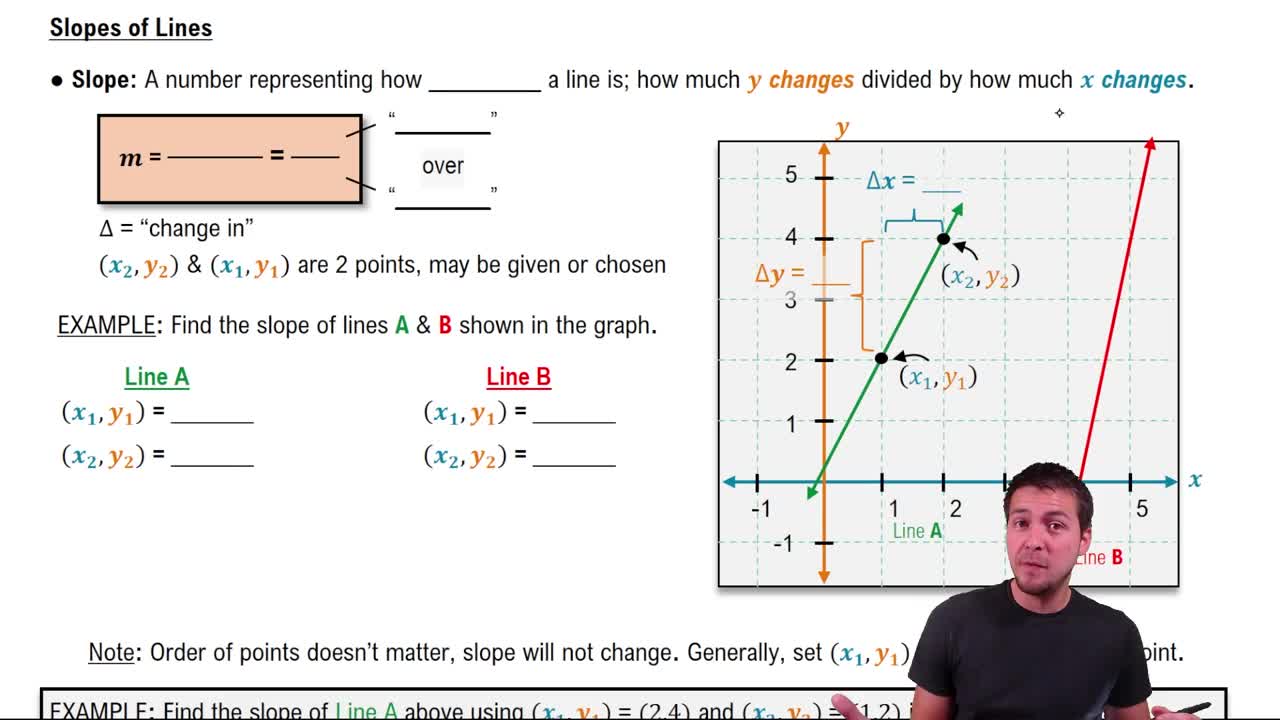
The Slope of a Line

Definition of a Function

A function is a relation where each input (x-value) has exactly one output (y-value). This means no x-value can be paired with more than one y-value. Understanding this definition is essential to applying the vertical line test correctly.
추천 영상:
5:57
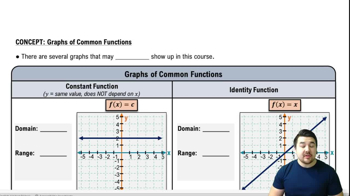
Graphs of Common Functions

Graph Interpretation

Interpreting graphs involves understanding the relationship between x and y coordinates. In the given image, the oval shape crosses some vertical lines more than once, indicating multiple y-values for a single x-value, which helps conclude whether the graph is a function.
추천 영상:
가이드 코스
02:16
Graphs and Coordinates - Example