Ch. 2 - Functions and Graphs
Blitzer - College Algebra 8th Edition
Blitzer8th EditionCollege AlgebraISBN: 9780136970514당신이 사용하는 게 아니라요?교과서 변경
3장, 문제 87

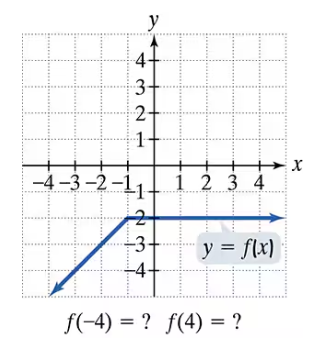
In Exercises 77–92, use the graph to determine a. the function's domain; b. the function's range; c. the x-intercepts, if any; d. the y-intercept, if any; and e. the missing function values, indicated by question marks, below each graph.
Graph showing a piecewise function with a line segment and a horizontal line, missing values at x = -4 and x = 4.

검증된 단계별 안내
1
Step 1: Determine the domain of the function by identifying all the x-values for which the function is defined. Look at the graph and note the starting and ending points along the x-axis where the function exists.
Step 2: Determine the range of the function by identifying all the y-values that the function takes. Observe the lowest and highest points on the graph along the y-axis.
Step 3: Find the x-intercepts by locating points where the graph crosses the x-axis (where y = 0). Check if the graph touches or crosses the x-axis and note those x-values.
Step 4: Find the y-intercept by identifying the point where the graph crosses the y-axis (where x = 0). Note the y-value at this point.
Step 5: To find the missing function values f(-4) and f(4), look at the graph at x = -4 and x = 4. For x = -4, find the corresponding y-value on the graph. For x = 4, observe the horizontal line segment and determine the y-value it holds at that point.

비슷한 문제에 대한 검증된 영상 답변:

이 영상 해법은 위 문제에 도움이 된다고 튜터들이 추천한 것입니다.
영상 길이:
3m
도움이 되었나요?

주요 개념

질문에 올바르게 답하기 위해 반드시 이해해야 하는 핵심 개념들은 다음과 같습니다.

Domain of a Function

The domain of a function is the set of all possible input values (x-values) for which the function is defined. In a graph, the domain corresponds to the horizontal extent of the graph, including all x-values where the function has points or segments.
추천 영상:
3:51
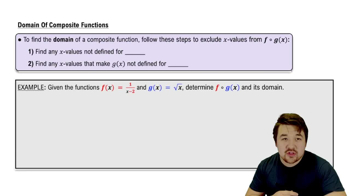
Domain Restrictions of Composed Functions

Range of a Function

The range of a function is the set of all possible output values (y-values) that the function can produce. On a graph, the range is the vertical span covered by the function's points or segments, showing all y-values the function attains.
추천 영상:
4:22
Domain & Range of Transformed Functions

Intercepts and Function Values

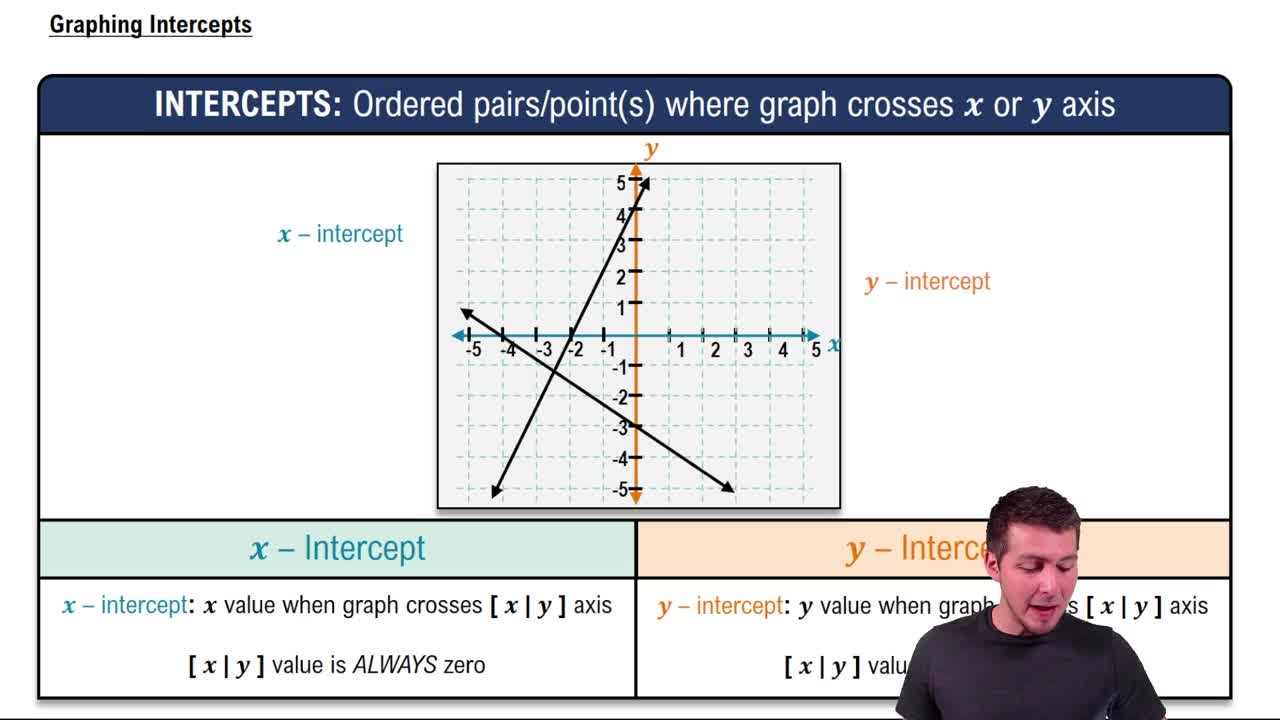
X-intercepts are points where the graph crosses the x-axis (y=0), and y-intercepts are points where the graph crosses the y-axis (x=0). Missing function values at specific x-values can be found by locating those x-values on the graph and reading the corresponding y-values.
추천 영상:
04:08
Graphing Intercepts