Ch. 2 - Functions and Graphs
Blitzer - College Algebra 8th Edition
Blitzer8th EditionCollege AlgebraISBN: 9780136970514당신이 사용하는 게 아니라요?교과서 변경
3장, 문제 80

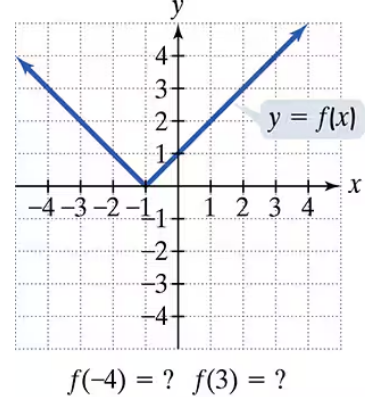
In Exercises 77–92, use the graph to determine a. the function's range; b. the y-intercept, if any; and e. the missing function values, indicated by question marks, below each graph.

검증된 단계별 안내
1
Step 1: Identify the range of the function by looking at the y-values covered by the graph. The graph starts at the point (0, 4) and goes down to (4, 0), so the y-values range from 0 to 4, inclusive of 0 but exclusive of 4 because the point (4, 0) is an open circle on the x-axis.
Step 2: Determine the y-intercept by finding where the graph crosses the y-axis. The graph crosses the y-axis at the point (0, 4), so the y-intercept is 4.
Step 3: To find the missing function values indicated by question marks, observe the x-values given and use the graph to find the corresponding y-values. For example, if you need the function value at x = 2, locate x = 2 on the x-axis and find the y-value on the curve directly above or below it.
Step 4: Note that the graph is a curve that appears to be part of a circle or a similar shape, so the function might be defined by an equation involving a square root or a quadratic expression. Use the known points (0, 4) and (4, 0) to help determine the function's formula if needed.
Step 5: Verify the function values by checking if they lie on the curve between the points (0, 4) and (4, 0), ensuring the values are consistent with the shape and domain of the function.

비슷한 문제에 대한 검증된 영상 답변:

이 영상 해법은 위 문제에 도움이 된다고 튜터들이 추천한 것입니다.
영상 길이:
3m
도움이 되었나요?

주요 개념

질문에 올바르게 답하기 위해 반드시 이해해야 하는 핵심 개념들은 다음과 같습니다.

Function Range

The range of a function is the set of all possible output values (y-values) that the function can produce. To find the range from a graph, identify the lowest and highest points on the curve along the y-axis. In this graph, the range includes all y-values from 0 to 4, inclusive of 4 but not including 0 at x=4 due to the open circle.
추천 영상:
4:22
Domain & Range of Transformed Functions

Y-Intercept

The y-intercept is the point where the graph crosses the y-axis, representing the function value when x = 0. It is found by locating the point on the graph with an x-coordinate of zero. Here, the y-intercept is at (0, 4), indicating the function's value is 4 when x is zero.
추천 영상:
04:08
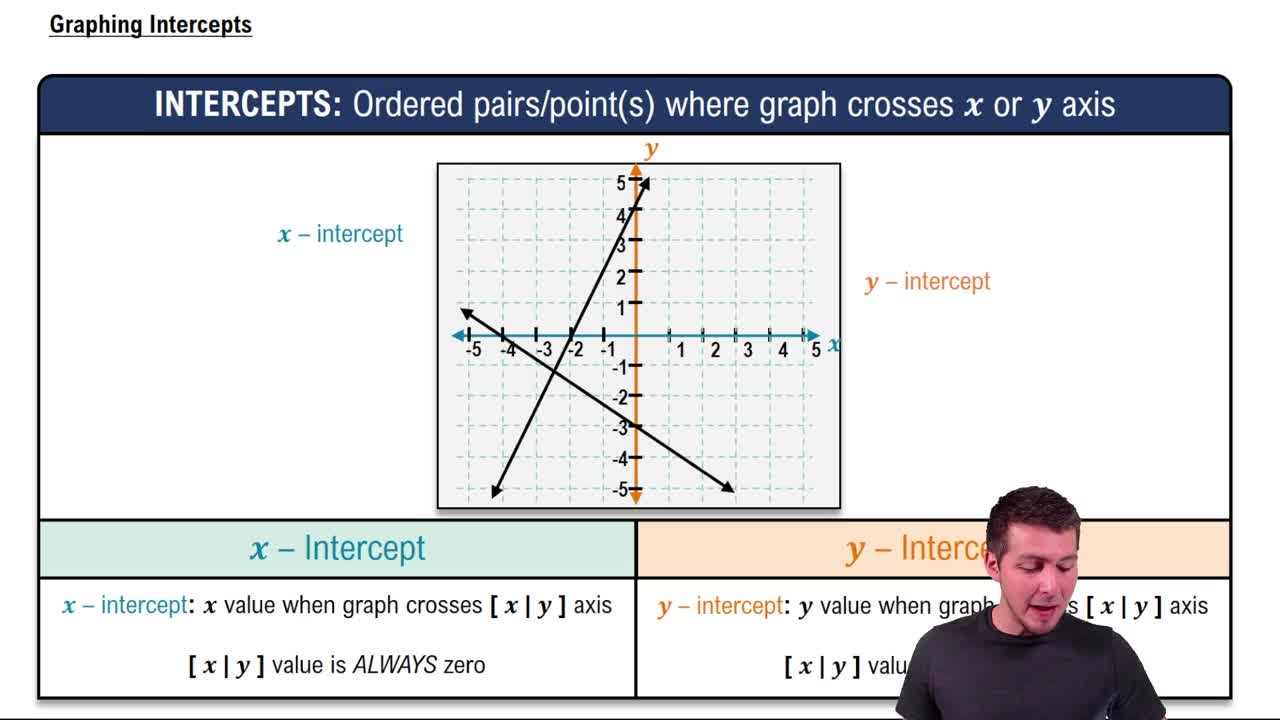
Graphing Intercepts

Interpreting Open and Closed Points on Graphs

Open and closed points on a graph indicate whether a function value is included or excluded at that point. A closed dot means the value is included, while an open circle means it is excluded. In this graph, the open circle at (4, 0) shows the function does not include the value 0 at x = 4, affecting the range and function values.
추천 영상:
04:29
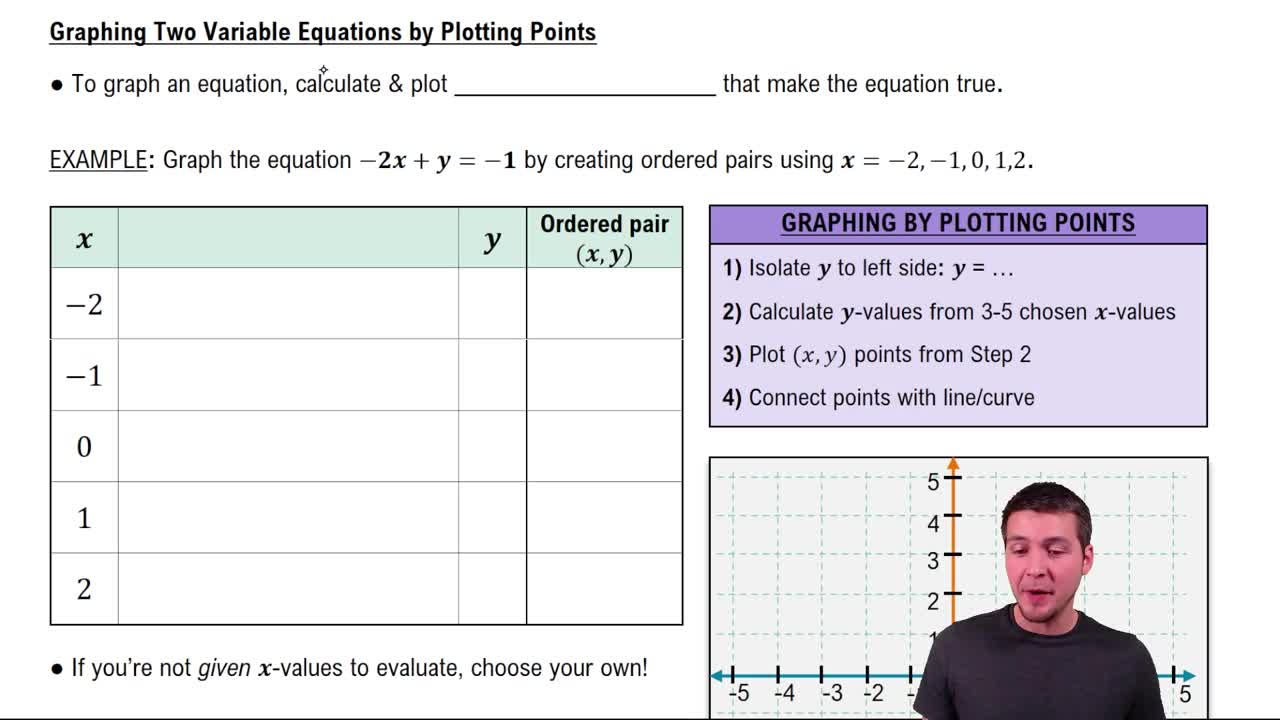
Graphing Equations of Two Variables by Plotting Points