In Exercises 81–88, a. Find the slant asymptote of the graph of each rational function and b. Follow the seven-step strategy and use the slant asymptote to graph each rational function. f(x)=(x2+x−6)/(x−3)
Ch. 3 - Polynomial and Rational Functions

4장, 문제 86
Solve each inequality in Exercises 86–91 using a graphing utility. x2 + 3x - 10 > 0
검증된 단계별 안내1
Rewrite the inequality to understand the expression clearly: \(x^{2} + 3x - 10 > 0\).
Find the roots of the quadratic equation \(x^{2} + 3x - 10 = 0\) by using the quadratic formula: \(x = \frac{-b \pm \sqrt{b^{2} - 4ac}}{2a}\), where \(a=1\), \(b=3\), and \(c=-10\).
Calculate the discriminant \(\Delta = b^{2} - 4ac\) to determine the nature of the roots.
Use the roots found to divide the number line into intervals. Test a value from each interval in the inequality \(x^{2} + 3x - 10 > 0\) to determine where the inequality holds true.
Express the solution set as intervals where the quadratic expression is greater than zero, based on the test results from the intervals.

비슷한 문제에 대한 검증된 영상 답변:
이 영상 해법은 위 문제에 도움이 된다고 튜터들이 추천한 것입니다.
영상 길이:
1m도움이 되었나요?
주요 개념
질문에 올바르게 답하기 위해 반드시 이해해야 하는 핵심 개념들은 다음과 같습니다.
Quadratic Inequalities
A quadratic inequality involves a quadratic expression set greater than or less than a value, often zero. Solving it means finding the range of x-values where the inequality holds true. This typically requires identifying where the quadratic expression is positive or negative.
추천 영상:
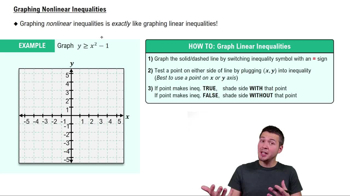
Nonlinear Inequalities
Graphing Quadratic Functions
Graphing a quadratic function y = ax² + bx + c helps visualize its shape (a parabola) and identify where it lies above or below the x-axis. The points where the graph crosses the x-axis (roots) divide the number line into intervals to test for the inequality.
추천 영상:
Graphs of Logarithmic Functions
Using a Graphing Utility
A graphing utility is a tool or calculator that plots functions quickly and accurately. It helps find the roots of the quadratic and shows where the graph is above or below the x-axis, making it easier to determine the solution set for the inequality.
추천 영상:
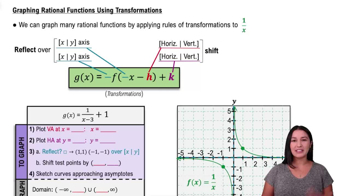
Graphing Rational Functions Using Transformations
관련 실천
교과서 질문
629
views
교과서 질문
Exercises 82–84 will help you prepare for the material covered in the next section. Let f(x)=an(x4−3x2−4). If f(3)=−150, determine the value of a_n.
370
views
교과서 질문
Solve each inequality in Exercises 86–91 using a graphing utility. 2x2 + 5x - 3 ≤ 0
577
views
교과서 질문
In Exercises 81–88, a. Find the slant asymptote of the graph of each rational function and b. Follow the seven-step strategy and use the slant asymptote to graph each rational function. f(x)=(x3+1)/(x2+2x)
601
views
교과서 질문
In Exercises 81–88, a. Find the slant asymptote of the graph of each rational function and b. Follow the seven-step strategy and use the slant asymptote to graph each rational function. f(x)=(x2+1)/x
604
views
교과서 질문
Solve each inequality in Exercises 86–91 using a graphing utility. x3 + x2 - 4x - 4 > 0
548
views