Ch. 2 - Graphs and Functions
Lial - College Algebra 13th Edition
Lial13th EditionCollege AlgebraISBN: 9780136881063당신이 사용하는 게 아니라요?교과서 변경
3장, 문제 33d

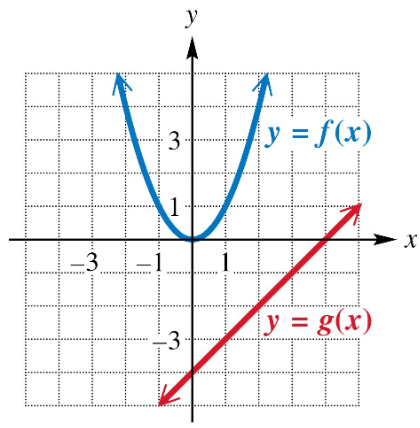
Use the graph to evaluate each expression. See Example 3(a).
(ƒ/g)(1)

검증된 단계별 안내
1
Identify the value of the functions f(x) and g(x) at x = 1 from the graph. Locate x = 1 on the x-axis and find the corresponding y-values for both f(x) (red parabola) and g(x) (blue line).
Read the y-value for f(1) from the red parabola. This is the height of the red curve at x = 1.
Read the y-value for g(1) from the blue line. This is the height of the blue line at x = 1.
Set up the expression (f/g)(1) which means \( \frac{f(1)}{g(1)} \).
Divide the value of f(1) by the value of g(1) to evaluate (f/g)(1). Remember to keep the values as they are without calculating the final numerical result.

비슷한 문제에 대한 검증된 영상 답변:

이 영상 해법은 위 문제에 도움이 된다고 튜터들이 추천한 것입니다.
영상 길이:
3m
도움이 되었나요?

주요 개념

질문에 올바르게 답하기 위해 반드시 이해해야 하는 핵심 개념들은 다음과 같습니다.

Function Evaluation from a Graph

Function evaluation involves finding the output value of a function for a given input. Using a graph, you locate the input value on the x-axis, then find the corresponding point on the function's curve to determine the output on the y-axis. This skill is essential for interpreting and solving problems involving functions visually.
추천 영상:
4:26
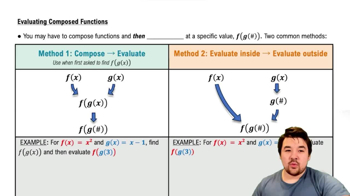
Evaluating Composed Functions

Function Division (ƒ/g)(x)

The division of two functions, (ƒ/g)(x), means dividing the output of f(x) by the output of g(x) for the same input x. It is important to ensure g(x) ≠ 0 to avoid undefined expressions. This concept combines understanding of function operations and domain restrictions.
추천 영상:
7:24
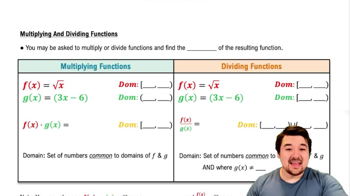
Multiplying & Dividing Functions

Reading and Interpreting Multiple Functions on a Graph

When multiple functions are graphed together, distinguishing between them by color or label is crucial. Understanding their shapes and behavior helps in evaluating expressions involving both functions, such as sums, differences, products, or quotients, by comparing their values at specific points.
추천 영상:
5:46
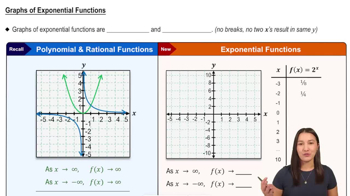
Graphs of Exponential Functions