Ch.11 - Liquids & Phase Changes
McMurry - Chemistry 8th Edition
McMurry8th EditionChemistryISBN: 9781292336145당신이 사용하는 게 아니라요?교과서 변경
11장, 문제 77

Substance X has a vapor pressure of 100 mm Hg at its triple point (48 °C). When 1 mol of X is heated at 1 atm pres- sure with a constant rate of heat input, the following heating curve is obtained: (b) For each of the following, choose which phase of X (solid, liquid, or gas) fits the description. (iii) Has the greatest specific heatHeating curve of substance X showing phases and temperature changes.

검증된 단계별 안내
1
Identify the different phases of substance X on the heating curve. The flat regions represent phase changes (solid to liquid, liquid to gas), and the sloped regions represent temperature changes within a single phase.
Determine the specific heat capacity for each phase. The specific heat capacity is related to the slope of the temperature change regions; a steeper slope indicates a lower specific heat capacity, while a gentler slope indicates a higher specific heat capacity.
Compare the slopes of the solid, liquid, and gas phases. The phase with the gentlest slope (least steep) will have the greatest specific heat capacity.
Analyze the heating curve: the first sloped region represents the solid phase, the second sloped region represents the liquid phase, and the third sloped region represents the gas phase.
Conclude which phase has the greatest specific heat capacity based on the slope analysis. The phase with the gentlest slope (least steep) is the one with the greatest specific heat capacity.

비슷한 문제에 대한 검증된 영상 답변:

이 영상 해법은 위 문제에 도움이 된다고 튜터들이 추천한 것입니다.
영상 길이:
2m

주요 개념

질문에 올바르게 답하기 위해 반드시 이해해야 하는 핵심 개념들은 다음과 같습니다.

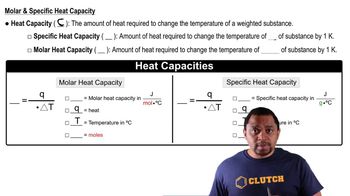
Specific Heat Capacity

Specific heat capacity is the amount of heat required to raise the temperature of one gram of a substance by one degree Celsius. Different phases of a substance (solid, liquid, gas) have varying specific heat capacities due to differences in molecular structure and bonding. Generally, gases have lower specific heat capacities than liquids, and liquids have lower specific heat capacities than solids, making it essential to identify which phase has the greatest specific heat in a heating curve.
추천 영상:

Heating Curve

A heating curve is a graphical representation that shows the temperature change of a substance as it is heated over time. It typically includes flat regions where phase changes occur (melting, boiling) and sloped regions where the temperature of a single phase increases. Analyzing the heating curve allows us to determine the phases present at different temperatures and the specific heat capacities associated with each phase.
추천 영상:
가이드 코스
01:05
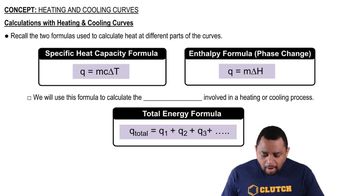
Calculations with Heating and Cooling Curves

Phase Changes

Phase changes refer to the transitions between solid, liquid, and gas states of matter, which occur at specific temperatures and pressures. During these transitions, the temperature remains constant while heat energy is absorbed or released, leading to changes in the arrangement and energy of molecules. Understanding phase changes is crucial for interpreting heating curves and determining which phase of a substance has the greatest specific heat.
추천 영상:
가이드 코스
01:46
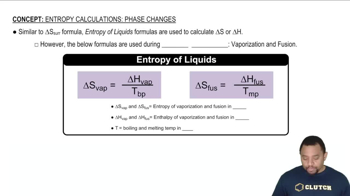
Entropy in Phase Changes