Ch.14 - Chemical Kinetics
McMurry - Chemistry 8th Edition
McMurry8th EditionChemistryISBN: 9781292336145당신이 사용하는 게 아니라요?교과서 변경
14장, 문제 52

Use the information in Table 14.1 and Figure 14.1 to estimate the instantaneous rate of appearance of NO2 at t = 350 s by calculating the average rate of appearance of NO2 over the following time intervals centered on t = 350 s. (a) 0 to 700 s (b) 100 to 600 s (c) 200 to 500 s (d) 300 to 400 s Which is the best estimate, and why?

검증된 단계별 안내
1
Identify the concentration of NO2 at the given time intervals from Table 14.1 and Figure 14.1.
Calculate the average rate of appearance of NO2 for each interval using the formula: \( \text{Average Rate} = \frac{[\text{NO}_2]_\text{final} - [\text{NO}_2]_\text{initial}}{t_\text{final} - t_\text{initial}} \).
For interval (a) 0 to 700 s, use the concentrations at 0 s and 700 s to find the average rate.
For interval (b) 100 to 600 s, use the concentrations at 100 s and 600 s to find the average rate.
Compare the average rates calculated for each interval to determine which is closest to the instantaneous rate at t = 350 s, considering that shorter intervals around 350 s provide a better estimate.

비슷한 문제에 대한 검증된 영상 답변:

이 영상 해법은 위 문제에 도움이 된다고 튜터들이 추천한 것입니다.
영상 길이:
4m

주요 개념

질문에 올바르게 답하기 위해 반드시 이해해야 하는 핵심 개념들은 다음과 같습니다.

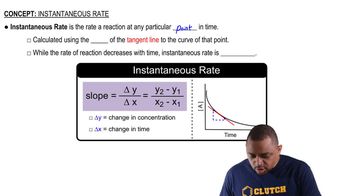
Instantaneous Rate vs. Average Rate

The instantaneous rate of a reaction refers to the rate at a specific moment in time, while the average rate is calculated over a defined time interval. To estimate the instantaneous rate at t = 350 s, one can analyze the average rates over various intervals that include this time point. Understanding the difference between these rates is crucial for accurately interpreting the data.
추천 영상:
가이드 코스
01:30
Instantaneous Rate

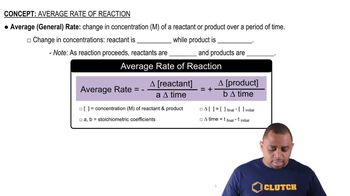
Rate of Reaction

The rate of reaction quantifies how quickly reactants are converted into products. It can be expressed in terms of the change in concentration of a reactant or product over time. In this case, the focus is on the appearance of NO2, which requires calculating the change in its concentration over the specified time intervals to determine the rate.
추천 영상:
가이드 코스
02:03
Average Rate of Reaction

Data Interpretation from Graphs and Tables

Interpreting data from tables and graphs is essential for estimating rates of reaction. Table 14.1 likely provides concentration values at various times, while Figure 14.1 may illustrate the concentration changes graphically. Understanding how to extract and analyze this information allows for accurate calculations of average rates over the specified intervals.
추천 영상:
가이드 코스
02:40
Periodic Table Classifications