Ch. 10 - Eukaryotic Chromosome Abnormalities and Molecular Organization
Sanders - Genetic Analysis: An Integrated Approach 3rd Edition
Sanders3rd EditionGenetic Analysis: An Integrated ApproachISBN: 9780135564172당신이 사용하는 게 아니라요?교과서 변경
10장, 문제 18

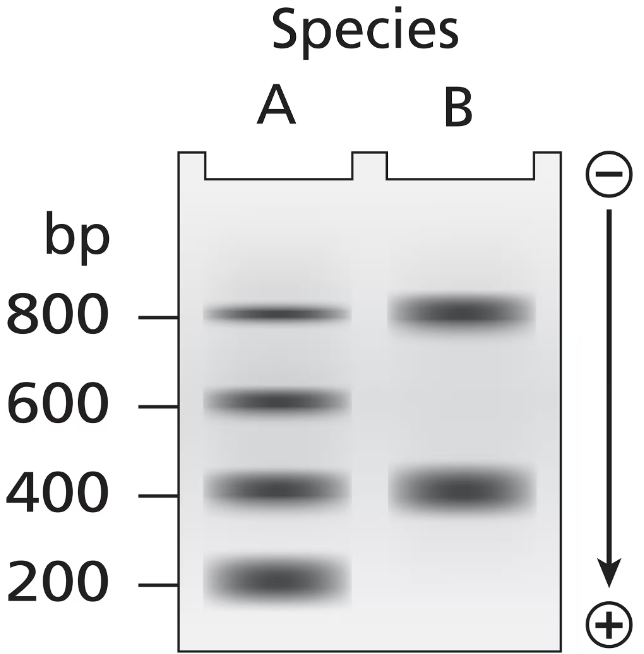
A survey of organisms living deep in the ocean reveals two new species whose DNA is isolated for analysis. DNA samples from both species are treated to remove nonhistone proteins. Each DNA sample is then treated with DNase I that cuts DNA not protected by histone proteins but is unable to cut DNA bound by histone proteins. Following DNase I treatment, DNA samples are subjected to gel electrophoresis, and the gels are stained to visualize all DNA bands in the gel. The staining patterns of DNA bands from each species are shown in the figure. The number of base pairs in small DNA fragments is shown at the left of the gel. Interpret the gel results in terms of chromatin organization and the spacing of nucleosomes in the chromatin of each species.
Gel electrophoresis image showing DNA bands from two species, with base pair sizes indicated on the left.

검증된 단계별 안내
1
Step 1: Understand the role of DNase I in the experiment. DNase I is an enzyme that cuts DNA at regions not protected by histone proteins. Histone proteins are part of nucleosomes, which protect DNA from enzymatic cleavage. Therefore, DNase I treatment reveals the organization of chromatin and the spacing of nucleosomes.
Step 2: Analyze the gel electrophoresis results. Gel electrophoresis separates DNA fragments based on size, with smaller fragments migrating further down the gel. The stained bands represent DNA fragments of different sizes, which correspond to the regions of DNA that were not protected by histones and were cleaved by DNase I.
Step 3: Compare the banding patterns of the two species. Differences in the banding patterns indicate variations in chromatin organization and nucleosome spacing. For example, closely spaced bands suggest shorter nucleosome spacing, while widely spaced bands suggest longer nucleosome spacing.
Step 4: Interpret the chromatin organization for each species. If one species shows a pattern of evenly spaced bands, it suggests regular nucleosome spacing. If the other species shows irregular or fewer bands, it may indicate less organized chromatin or differences in nucleosome density.
Step 5: Relate the findings to the biological significance. Differences in chromatin organization and nucleosome spacing can affect gene expression, DNA accessibility, and overall genome regulation. Consider how these differences might reflect adaptations to the deep ocean environment for each species.

비슷한 문제에 대한 검증된 영상 답변:

이 영상 해법은 위 문제에 도움이 된다고 튜터들이 추천한 것입니다.
영상 길이:
2m
도움이 되었나요?

주요 개념

질문에 올바르게 답하기 위해 반드시 이해해야 하는 핵심 개념들은 다음과 같습니다.

Chromatin Structure

Chromatin is a complex of DNA and proteins found in the nucleus of eukaryotic cells, primarily composed of histones. It exists in two forms: euchromatin, which is loosely packed and transcriptionally active, and heterochromatin, which is tightly packed and transcriptionally inactive. The organization of chromatin affects gene expression and DNA accessibility, making it crucial for understanding how DNA is protected or exposed during experiments like DNase I treatment.
추천 영상:

Nucleosome Spacing

Nucleosomes are the fundamental units of chromatin, consisting of a segment of DNA wrapped around a core of histone proteins. The spacing between nucleosomes can vary, influencing the accessibility of DNA for transcription and other processes. In the context of DNase I treatment, the spacing determines which DNA fragments are protected from cleavage, leading to distinct patterns in gel electrophoresis that reflect the chromatin organization of each species.
추천 영상:

Gel Electrophoresis

Gel electrophoresis is a laboratory technique used to separate DNA fragments based on their size. When an electric current is applied, negatively charged DNA moves through a gel matrix, with smaller fragments migrating faster than larger ones. The resulting banding pattern allows researchers to visualize and compare the sizes of DNA fragments, providing insights into chromatin structure and the effects of treatments like DNase I on different species' DNA.
추천 영상:
관련 실천
교과서 질문

The accompanying chromosome diagram represents a eukaryotic chromosome prepared with Giemsa stain. Indicate the heterochromatic and euchromatic regions of the chromosome, and label the chromosome's centromeric and telomeric regions.

Why are expressed genes not found in the telomeric region of chromosomes?

560
views
교과서 질문

A plant breeder would like to develop a seedless variety of cucumber from two existing lines. Line A is a tetraploid line, and line B is a diploid line. Describe the breeding strategy that will produce a seedless line, and support your strategy by describing the results of crosses.

484
views
교과서 질문

The accompanying chromosome diagram represents a eukaryotic chromosome prepared with Giemsa stain. Indicate the heterochromatic and euchromatic regions of the chromosome, and label the chromosome's centromeric and telomeric regions.

Are you more likely to find the DNA sequence encoding the digestive enzyme amylase in a heterochromatic, euchromatic, centromeric, or telomeric region? Explain your reasoning.

561
views
교과서 질문

In humans that are XX/XO mosaics, the phenotype is highly variable, ranging from females who have classic Turner syndrome symptoms to females who are essentially normal. Likewise, XY/XO mosaics have phenotypes that range from Turner syndrome females to essentially normal males. How can the wide range of phenotypes be explained for these sex-chromosome mosaics?

663
views
교과서 질문

In Drosophila, seven partial deletions (1 to 7) shown as gaps in the following diagram have been mapped on a chromosome. This region of the chromosome contains genes that express seven recessive mutant phenotypes, identified in the following table as a through g. A researcher wants to determine the location and order of genes on the chromosome, so he sets up a series of crosses in which flies homozygous for a mutant allele are crossed with flies homozygous for a partial deletion. The progeny are scored to determine whether they have the mutant phenotype ('m' in the table) or the wild-type phenotype ('+' in the table). Use the partial deletion map and the table of progeny phenotypes to determine the order of genes on the chromosome.

634
views
교과서 질문

Histone protein H4 isolated from pea plants and cow thymus glands contains 102 amino acids in both cases. A total of 100 of the amino acids are identical between the two species. Give an evolutionary explanation for this strong amino acid sequence identity based on what you know about the functions of histones and nucleosomes.

476
views