Ch. 19 - Genetic Analysis of Quantitative Traits
Sanders - Genetic Analysis: An Integrated Approach 3rd Edition
Sanders3rd EditionGenetic Analysis: An Integrated ApproachISBN: 9780135564172당신이 사용하는 게 아니라요?교과서 변경
19장, 문제 31a

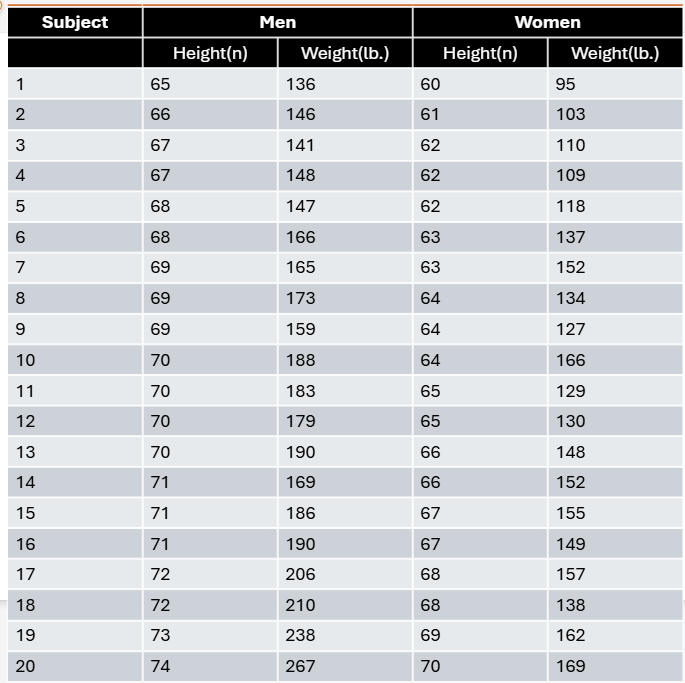
A total of 20 men and 20 women volunteer to participate in a statistics project. The height and weight of each subject are given in the table. Draw one histogram for the height of the subjects and a separate histogram for weight. Use different colors for men and women so that you can visually compare the distributions by sex and plot weights in 10-lb intervals (i.e., 90–99 lb, 100–109 lb, 110–119 lb, etc.).
Table showing height and weight data for 20 men and 20 women, with separate columns for each measurement.

검증된 단계별 안내
1
Step 1: Organize the data by separating the height and weight values for men and women into two distinct groups. This will help in plotting the histograms clearly for each sex.
Step 2: Decide on the bin intervals for the histograms. For height, choose appropriate intervals (e.g., 5 or 10 cm/inches) that cover the range of heights for all subjects. For weight, use the specified 10-lb intervals such as 90–99 lb, 100–109 lb, 110–119 lb, and so on.
Step 3: Count the number of men and women whose heights fall into each height interval. Repeat this counting process for weights using the 10-lb intervals, separately for men and women.
Step 4: Draw two separate histograms: one for height and one for weight. Use different colors to represent men and women in each histogram, so that the distributions can be visually compared side by side within each bin.
Step 5: Label the axes clearly—x-axis with the height or weight intervals, and y-axis with the frequency (number of subjects). Add a legend to indicate which color corresponds to men and which to women.

비슷한 문제에 대한 검증된 영상 답변:

이 영상 해법은 위 문제에 도움이 된다고 튜터들이 추천한 것입니다.
영상 길이:
1m

주요 개념

질문에 올바르게 답하기 위해 반드시 이해해야 하는 핵심 개념들은 다음과 같습니다.

Histogram Construction

A histogram is a graphical representation of data distribution using bars to show frequency within specified intervals or bins. Each bar's height reflects the number of data points in that range. Understanding how to group continuous data into intervals is essential for creating meaningful histograms.
추천 영상:
가이드 코스
08:16
Phylogenetic Trees

Data Stratification by Categories

Stratifying data involves separating it into distinct groups, such as men and women, to compare distributions within each category. Using different colors for each group in a histogram helps visually distinguish and analyze differences or similarities between these subpopulations.
추천 영상:
가이드 코스
13:40
Traits and Variance

Interval Binning for Weight Data

Interval binning groups continuous data into fixed ranges, such as 10-lb intervals for weight (e.g., 90–99 lb). This simplifies data visualization and comparison by standardizing the scale and making patterns or trends easier to identify across groups.
추천 영상:
관련 실천
교과서 질문

A total of 20 men and 20 women volunteer to participate in a statistics project. The height and weight of each subject are given in the table. Compare the numerical values with the visual distribution of heights and weights you drew in the histograms and describe whether you think your visual impression matches the numerical values.

394
views
교과서 질문

A total of 20 men and 20 women volunteer to participate in a statistics project. The height and weight of each subject are given in the table. Calculate the mean, variance, and standard deviation for height and weight in men and women.

404
views
교과서 질문

A three-gene system of additive genes (A, B, and C) controls plant height. Each gene has two alleles (A and a, B and b, and C and c). There is dominance among the alleles of each gene, with alleles A, B, and C dominant over a, b, and c. Under this scheme, the dominant genotype for a gene contributes 10 cm to height potential, and the recessive genotype contributes 4 cm. What is the height potential of a plant that is homozygous for all three dominant alleles?

837
views
교과서 질문
A three-gene system of additive genes (A, B, and C) controls plant height. Each gene has two alleles (A and a, B and b, and C and c). There is dominance among the alleles of each gene, with alleles A, B, and C dominant over a, b, and c. Under this scheme, the dominant genotype for a gene contributes 10 cm to height potential, and the recessive genotype contributes 4 cm. What is the height potential of a plant that is homozygous for all three recessive alleles?
633
views
교과서 질문

Congenital dislocation of the hip is a threshold condition in which the head of the femur (the femoral head) is out of its normal position relative to the bones that will form the socket of the hip (the acetabulum). This misplacement can lead to potentially serious orthopedic problems later in life if the condition is not treated in infancy. Numerous studies have shown that:

(a) Brothers and sisters of infants born with congenital hip dislocation are more likely to develop the condition than are the siblings of those without the condition. These studies also find that

(b) More female infants than male infants have the trait, and

(c) If the affected child is a girl, the risk to her siblings is lower than if the affected infant is a boy.

Explain the meaning of the three observations (a, b, and c) in the context of proposing a threshold model that explains these observations.

393
views