Ch. 5 - Genetic Linkage and Mapping in Eukaryotes
Sanders - Genetic Analysis: An Integrated Approach 3rd Edition
Sanders3rd EditionGenetic Analysis: An Integrated ApproachISBN: 9780135564172당신이 사용하는 게 아니라요?교과서 변경
5장, 문제 13b

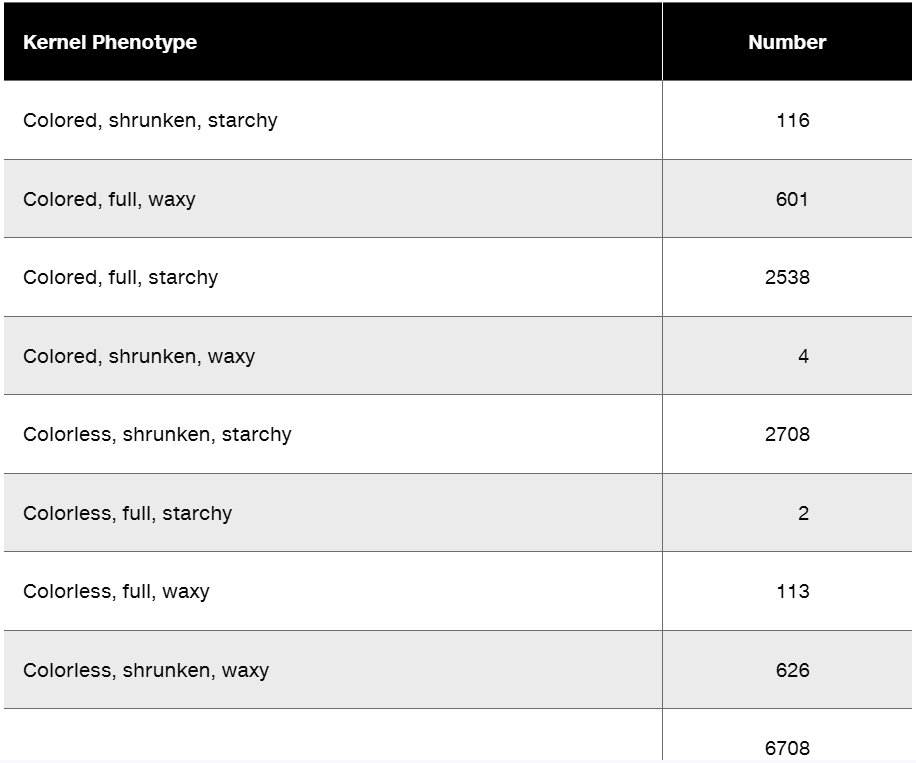
Researchers cross a corn plant that is pure-breeding for the dominant traits colored aleurone (C1), full kernel (Sh), and waxy endosperm (Wx) to a pure-breeding plant with the recessive traits colorless aleurone (c1), shrunken kernel (sh), and starchy (wx). The resulting F₁ plants were crossed to pure-breeding colorless, shrunken, starchy plants. Counting the kernels from about 30 ears of corn yields the following data.


Table displaying kernel phenotypes and their corresponding counts from a corn plant genetic study.
Perform a chi-square test to determine if these data show significant deviation from the expected phenotype distribution.

검증된 단계별 안내
1
Step 1: Define the hypothesis. The null hypothesis (H₀) assumes that the observed data follows the expected Mendelian inheritance pattern for the traits in question. The alternative hypothesis (H₁) assumes that the observed data significantly deviates from the expected pattern.
Step 2: Determine the expected phenotype ratios. Since the F₁ plants were crossed to pure-breeding recessive plants, this is a test cross. For three independently assorting traits, the expected phenotypic ratio is 1:1:1:1:1:1:1:1 (8 phenotypes, each equally likely).
Step 3: Calculate the expected number of kernels for each phenotype. Divide the total number of kernels (6708) by 8 to find the expected count for each phenotype. Use the formula: E = Total8.
Step 4: Compute the chi-square value. For each phenotype, use the formula: χ2 = Σ ((O - E)2E), where O is the observed count and E is the expected count. Sum the values for all 8 phenotypes.
Step 5: Compare the chi-square value to the critical value. Determine the degrees of freedom (df = number of phenotypes - 1 = 8 - 1 = 7). Use a chi-square distribution table to find the critical value at a chosen significance level (e.g., 0.05). If the calculated chi-square value exceeds the critical value, reject the null hypothesis; otherwise, fail to reject it.

비슷한 문제에 대한 검증된 영상 답변:

이 영상 해법은 위 문제에 도움이 된다고 튜터들이 추천한 것입니다.
영상 길이:
6m
도움이 되었나요?

주요 개념

질문에 올바르게 답하기 위해 반드시 이해해야 하는 핵심 개념들은 다음과 같습니다.

Mendelian Genetics

Mendelian genetics is the study of how traits are inherited through generations based on the principles established by Gregor Mendel. It involves understanding dominant and recessive alleles, where dominant traits mask the expression of recessive ones. In this scenario, the traits of corn plants are analyzed through crosses, illustrating Mendel's laws of segregation and independent assortment.
추천 영상:
가이드 코스
03:45
Descriptive Genetics

Chi-Square Test

The chi-square test is a statistical method used to determine if there is a significant difference between observed and expected frequencies in categorical data. In genetics, it helps assess whether the distribution of phenotypes in offspring deviates from what is predicted by Mendelian inheritance. A significant result indicates that the observed data may not fit the expected genetic model.
추천 영상:
가이드 코스
02:48
Chi Square Analysis

Phenotypic Ratios

Phenotypic ratios represent the relative frequencies of different phenotypes resulting from a genetic cross. In this case, the expected ratios can be derived from the combinations of dominant and recessive traits. Analyzing these ratios helps in understanding the inheritance patterns and verifying if the observed data aligns with Mendelian predictions.
추천 영상:
가이드 코스
10:48
Mutations and Phenotypes
관련 실천
교과서 질문

Researchers cross a corn plant that is pure-breeding for the dominant traits colored aleurone (C1), full kernel (Sh), and waxy endosperm (Wx) to a pure-breeding plant with the recessive traits colorless aleurone (c1), shrunken kernel (sh), and starchy (wx). The resulting F₁ plants were crossed to pure-breeding colorless, shrunken, starchy plants. Counting the kernels from about 30 ears of corn yields the following data.

Why are these data consistent with genetic linkage among the three genes?

419
views
교과서 질문

Researchers cross a corn plant that is pure-breeding for the dominant traits colored aleurone (C1), full kernel (Sh), and waxy endosperm (Wx) to a pure-breeding plant with the recessive traits colorless aleurone (c1), shrunken kernel (sh), and starchy (wx). The resulting F₁ plants were crossed to pure-breeding colorless, shrunken, starchy plants. Counting the kernels from about 30 ears of corn yields the following data.

Calculate the recombination frequencies between the gene pairs.

649
views
교과서 질문

On the Drosophila X chromosome, the dominant allele y⁺ produces gray body color and the recessive allele y produces yellow body. This gene is linked to one controlling full eye shape by a dominant allele lz⁺ and lozenge eye shape with a recessive allele lz. These genes recombine with a frequency of approximately 28%. The Lz gene is linked to gene F controlling bristle form, where the dominant phenotype is long bristles and the recessive one is forked bristles. The Lz and F genes recombine with a frequency of approximately 32%.


Using any genotypes you choose, design two separate crosses, one to test recombination between genes Y and Lz and the second between genes Lz and F. Assume 1000 progeny are produced by each cross, and give the number of progeny in each outcome category. (In setting up your crosses, remember that Drosophila males do not undergo recombination.)

506
views
교과서 질문

On the Drosophila X chromosome, the dominant allele y⁺ produces gray body color and the recessive allele y produces yellow body. This gene is linked to one controlling full eye shape by a dominant allele lz⁺ and lozenge eye shape with a recessive allele lz. These genes recombine with a frequency of approximately 28%. The Lz gene is linked to gene F controlling bristle form, where the dominant phenotype is long bristles and the recessive one is forked bristles. The Lz and F genes recombine with a frequency of approximately 32%.


Can any cross reveal genetic linkage between gene Y and gene F? Why or why not?

384
views
교과서 질문

Researchers cross a corn plant that is pure-breeding for the dominant traits colored aleurone (C1), full kernel (Sh), and waxy endosperm (Wx) to a pure-breeding plant with the recessive traits colorless aleurone (c1), shrunken kernel (sh), and starchy (wx). The resulting F₁ plants were crossed to pure-breeding colorless, shrunken, starchy plants. Counting the kernels from about 30 ears of corn yields the following data.

What is the order of these genes in corn?

439
views
교과서 질문

Researchers cross a corn plant that is pure-breeding for the dominant traits colored aleurone (C1), full kernel (Sh), and waxy endosperm (Wx) to a pure-breeding plant with the recessive traits colorless aleurone (c1), shrunken kernel (sh), and starchy (wx). The resulting F₁ plants were crossed to pure-breeding colorless, shrunken, starchy plants. Counting the kernels from about 30 ears of corn yields the following data.

What is the interference value for this data set?

492
views