
교과서 질문
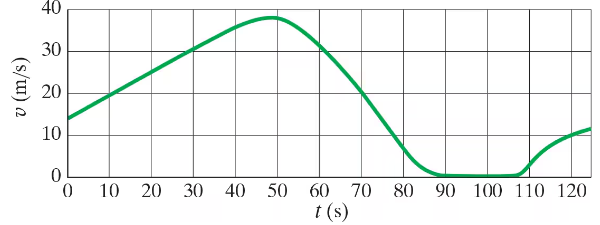
Figure 2–42 shows the velocity of a train as a function of time. At what time was its velocity greatest?
1216
views

 검증된 단계별 안내
 7:27
7:27
 08:59
08:59 07:32
07:32Figure 2–42 shows the velocity of a train as a function of time. At what time was its velocity greatest?
A baseball pitcher throws a baseball with a speed of 43 m/s. Estimate the average acceleration of the ball during the throwing motion. In throwing the baseball, the pitcher accelerates it through a displacement of about 3.5 m, from behind the body to the point where it is released (Fig. 2–44).
<IMAGE>
The position of an object is given by 𝓍 = At + Bt², where 𝓍 is in meters and t is in seconds. What are the units of A and B?
A car traveling 85 km/h slows down at a constant 0.50 m/s² just by 'letting up on the gas.' Calculate the distance it travels during the first and fifth seconds.
A bowling ball traveling with constant speed hits the pins at the end of a bowling lane 16.5 m long. The bowler hears the sound of the ball hitting the pins 2.75 s after the ball is released from his hands. What is the speed of the ball, assuming the speed of sound is 340 m/s?
Figure 2–42 shows the velocity of a train as a function of time. During what periods, if any, was the acceleration constant?