Ch. 02 - Describing Motion: Kinematics in One Dimension
Giancoli Douglas - Physics for Scientists and Engineers 5th edition
Giancoli Douglas5th editionPhysics for Scientists and EngineersISBN: 9780137488179당신이 사용하는 게 아니라요?교과서 변경
2장, 문제 30c

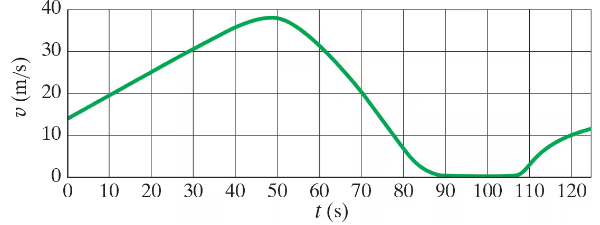
Figure 2–42 shows the velocity of a train as a function of time. During what periods, if any, was the acceleration constant?
0c

검증된 단계별 안내
1
Examine the velocity vs. time graph provided in the problem. Recall that acceleration is the rate of change of velocity with respect to time, mathematically expressed as \( a = \frac{\Delta v}{\Delta t} \). Constant acceleration implies that the graph should show a straight line (linear relationship) in the velocity vs. time plot.
Identify the segments of the graph where the slope (\( \frac{\Delta v}{\Delta t} \)) is constant. A constant slope indicates that the acceleration is uniform during that time interval.
For each segment of the graph, calculate the slope by selecting two points on the line and using the formula \( \text{slope} = \frac{v_2 - v_1}{t_2 - t_1} \). If the slope remains the same across the segment, the acceleration is constant.
Mark the time intervals corresponding to the segments with constant slope. These intervals represent the periods during which the acceleration was constant.
Summarize the identified time intervals and ensure they align with the graph's visual representation. Clearly state the periods of constant acceleration based on the analysis of the graph.

비슷한 문제에 대한 검증된 영상 답변:

이 영상 해법은 위 문제에 도움이 된다고 튜터들이 추천한 것입니다.
도움이 되었나요?

주요 개념

질문에 올바르게 답하기 위해 반드시 이해해야 하는 핵심 개념들은 다음과 같습니다.

Acceleration

Acceleration is defined as the rate of change of velocity with respect to time. It can be constant or variable, depending on whether the velocity changes uniformly or not. In a velocity vs. time graph, constant acceleration is indicated by a straight line, while a curved line suggests changing acceleration.
추천 영상:
가이드 코스
05:47
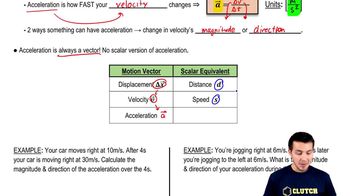
Intro to Acceleration

Velocity-Time Graphs

A velocity-time graph visually represents an object's velocity over time. The slope of the graph indicates acceleration; a positive slope means acceleration, while a negative slope indicates deceleration. Flat sections of the graph indicate constant velocity, and the shape of the graph helps identify periods of constant acceleration.
추천 영상:
가이드 코스
05:59
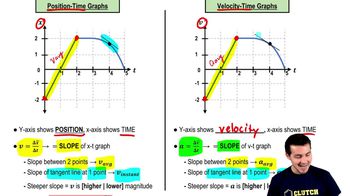
Velocity-Time Graphs & Acceleration

Intervals of Constant Acceleration

Intervals of constant acceleration occur when the velocity changes at a uniform rate over time. In a velocity-time graph, these intervals are represented by straight line segments. Identifying these intervals involves looking for sections where the slope remains unchanged, indicating that the acceleration is consistent throughout that period.
추천 영상:
가이드 코스
08:59
Phase Constant of a Wave Function