Ch 02: Kinematics in One Dimension
Knight Calc - Physics for Scientists and Engineers 5th Edition
Knight Calc5th EditionPhysics for Scientists and EngineersISBN: 9780137344796당신이 사용하는 게 아니라요?교과서 변경
2장, 문제 6a

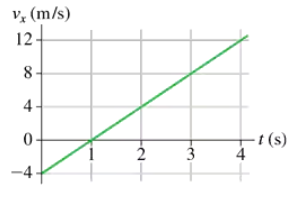
A particle starts from at and moves with the velocity graph shown in FIGURE EX2.6. Does this particle have a turning point? If so, at what time?

검증된 단계별 안내
1
Step 1: Understand the concept of a turning point. A turning point occurs when the velocity of the particle changes direction, i.e., when the velocity becomes zero and then reverses its sign.
Step 2: Analyze the velocity graph provided. The graph shows the velocity of the particle as a function of time. The velocity starts at 0 m/s, increases to 20 m/s, remains constant, and then decreases back to 0 m/s before becoming negative.
Step 3: Identify the time at which the velocity becomes zero after being positive. From the graph, the velocity decreases linearly and reaches 0 m/s at t = 10 seconds.
Step 4: Check if the velocity becomes negative after t = 10 seconds. The graph shows that the velocity becomes negative after t = 10 seconds, indicating a change in direction.
Step 5: Conclude that the particle has a turning point at t = 10 seconds, as this is the time when the velocity transitions from positive to zero and then to negative.

비슷한 문제에 대한 검증된 영상 답변:

이 영상 해법은 위 문제에 도움이 된다고 튜터들이 추천한 것입니다.
영상 길이:
1m
도움이 되었나요?

주요 개념

질문에 올바르게 답하기 위해 반드시 이해해야 하는 핵심 개념들은 다음과 같습니다.

Velocity and Turning Points

In physics, a turning point occurs when a particle changes its direction of motion. This is typically indicated by a change in the sign of the velocity. In a velocity-time graph, a turning point is where the velocity crosses the time axis, indicating that the particle has stopped and is about to move in the opposite direction.
추천 영상:
가이드 코스
08:35
Angular Momentum of a Point Mass

Velocity-Time Graph Interpretation

A velocity-time graph visually represents an object's velocity over time. The slope of the graph indicates acceleration, while the area under the curve represents displacement. In this case, the graph shows a constant velocity followed by a decrease, which suggests that the particle is moving at a steady speed before slowing down, potentially indicating a turning point.
추천 영상:
가이드 코스
05:59
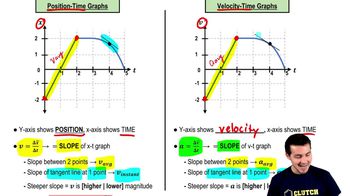
Velocity-Time Graphs & Acceleration

Constant Velocity

Constant velocity means that an object is moving at a uniform speed in a straight line, with no acceleration. In the provided graph, the particle maintains a velocity of 20 m/s for a period before decreasing. This constant velocity phase indicates that the particle is not experiencing any net forces acting on it, allowing it to move steadily until it begins to decelerate.
추천 영상:
가이드 코스
08:59
Phase Constant of a Wave Function