Ch 02: Kinematics in One Dimension
Knight Calc - Physics for Scientists and Engineers 5th Edition
Knight Calc5th EditionPhysics for Scientists and EngineersISBN: 9780137344796당신이 사용하는 게 아니라요?교과서 변경
2장, 문제 44

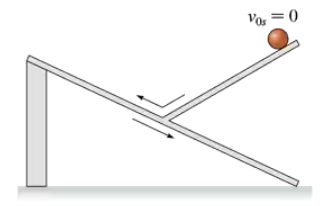
Draw position, velocity, and acceleration graphs for the ball shown in FIGURE P2.44. See Problem 43 for more information.

검증된 단계별 안내
1
Understand the motion of the ball: Based on the problem, the ball is likely undergoing vertical motion, such as being thrown upward and then coming back down under the influence of gravity. This means the position, velocity, and acceleration graphs will reflect this motion. Gravity will act as a constant downward acceleration throughout the motion.
Position graph: The position graph (y vs. t) will be a parabolic curve. The ball starts at an initial position, rises to a maximum height (where velocity is zero), and then falls back down. The curve will be concave down due to the negative acceleration caused by gravity.
Velocity graph: The velocity graph (v vs. t) will be a straight line with a negative slope. The velocity starts positive (if the ball is thrown upward), decreases to zero at the peak of the motion, and then becomes negative as the ball falls back down. The slope of this line represents the constant acceleration due to gravity.
Acceleration graph: The acceleration graph (a vs. t) will be a horizontal line below the time axis, representing a constant negative acceleration due to gravity. This value is typically -9.8 m/s² near the surface of the Earth.
Sketch the graphs: Using the above descriptions, draw the position graph as a parabola, the velocity graph as a straight line with a negative slope, and the acceleration graph as a horizontal line at -9.8 m/s². Ensure the time axis (t) is consistent across all graphs, and label the axes appropriately.

비슷한 문제에 대한 검증된 영상 답변:

이 영상 해법은 위 문제에 도움이 된다고 튜터들이 추천한 것입니다.
도움이 되었나요?

주요 개념

질문에 올바르게 답하기 위해 반드시 이해해야 하는 핵심 개념들은 다음과 같습니다.

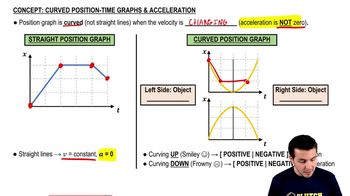
Position-Time Graphs

Position-time graphs illustrate how an object's position changes over time. The slope of the graph indicates the object's velocity, with a steeper slope representing higher speeds. A horizontal line indicates the object is at rest, while a curved line suggests acceleration. Understanding these graphs is crucial for analyzing motion in physics.
추천 영상:
가이드 코스
03:04
Curved Position-Time Graphs & Acceleration

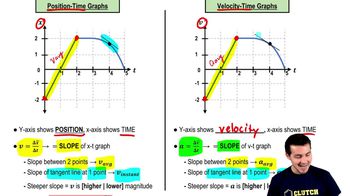
Velocity-Time Graphs

Velocity-time graphs depict an object's velocity as a function of time. The slope of this graph represents acceleration, while the area under the curve indicates the displacement of the object. A constant velocity appears as a horizontal line, while changes in slope indicate varying acceleration. This concept is essential for understanding how velocity changes during motion.
추천 영상:
가이드 코스
05:59
Velocity-Time Graphs & Acceleration

Acceleration

Acceleration is defined as the rate of change of velocity over time. It can be positive (speeding up), negative (slowing down), or zero (constant velocity). Understanding acceleration is vital for interpreting motion graphs, as it directly influences the shape and characteristics of both position and velocity graphs. It helps predict how an object's motion will evolve.
추천 영상:
가이드 코스
05:47
Intro to Acceleration
관련 실천
교과서 질문

A particle's velocity is given by the function vx=(2.0m/s)sin(πt)\(\mathcal{v}\)_x = (2.0 \, \(\text{m/s}\)) \(\sin\)(\(\pi\) t), where tt is in ss. What is the first time after t=0 st=0\(\text{ s}\) when the particle reaches a turning point?

2311
views

교과서 질문

You are driving to the grocery store at 20 m/s. You are 110 m from an intersection when the traffic light turns red. Assume that your reaction time is 0.50 s and that your car brakes with constant acceleration. What magnitude braking acceleration will bring you to a stop exactly at the intersection?

1702
views
교과서 질문

The takeoff speed for an Airbus A320 jetliner is 80 m/s. Velocity data measured during takeoff are as shown. Is the jetliner's acceleration constant during takeoff? Explain.

273
views
교과서 질문

A particle's velocity is described by the function vₓ =kt² m/s, where k is a constant and t is in s. The particle's position at t₀ = 0 s is x₀ = -9.0 m. At t₁ = 3.0 s, the particle is at x₁ = 9.0 m. Determine the value of the constant k. Be sure to include the proper units.

2827
views
교과서 질문

FIGURE P2.45 shows a set of kinematic graphs for a ball rolling on a track. All segments of the track are straight lines, but some may be tilted. Draw a picture of the track and also indicate the ball's initial condition.

1354
views
교과서 질문

A particle's velocity is given by the function vx=(2.0m/s)sin(πt)\(\mathcal{v}\)_x = (2.0 \, \(\text{m/s}\)) \(\sin\)(\(\pi\) t), where tt is in ss. What is the particle's acceleration at that time?

1895
views