FIGURE EX2.8 is a somewhat idealized graph of the velocity of blood in the ascending aorta during one beat of the heart. Approximately how far, in cm, does the blood move during one beat?
Ch 02: Kinematics in One Dimension
2장, 문제 12a
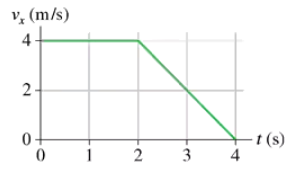
FIGURE EX2.12 shows the velocity-versus-time graph for a particle moving along the x-axis. Its initial position is at x0 = 2 m at t0 = 0 s. What are the particle's position, velocity, and acceleration at t = 1.0 s?

검증된 단계별 안내1
Step 1: Analyze the velocity-versus-time graph. From the graph, the velocity at t = 1.0s is constant and equal to 1 cm/s (0.01 m/s). This indicates that the particle is moving at a constant velocity during this time interval.
Step 2: Use the formula for position when velocity is constant: x = x₀ + v * t. Here, x₀ = 2 m (initial position), v = 0.01 m/s (velocity at t = 1.0s), and t = 1.0s. Substitute these values into the formula to calculate the position.
Step 3: Since the velocity is constant during the interval from t = 0s to t = 3s, the acceleration is zero. Acceleration is defined as the rate of change of velocity, a = (Δv)/(Δt). For t = 1.0s, Δv = 0, so a = 0 m/s².
Step 4: Summarize the results: At t = 1.0s, the particle's position can be calculated using the formula in Step 2, its velocity is 0.01 m/s, and its acceleration is 0 m/s².
Step 5: To verify, observe the graph again. The flat line from t = 0s to t = 3s confirms constant velocity, and no change in velocity means zero acceleration during this interval.

비슷한 문제에 대한 검증된 영상 답변:
이 영상 해법은 위 문제에 도움이 된다고 튜터들이 추천한 것입니다.
영상 길이:
6m도움이 되었나요?
주요 개념
질문에 올바르게 답하기 위해 반드시 이해해야 하는 핵심 개념들은 다음과 같습니다.
Velocity
Velocity is a vector quantity that describes the rate of change of an object's position with respect to time. It has both magnitude and direction, and is typically expressed in units such as meters per second (m/s). In the context of the velocity-versus-time graph, the value of velocity at any point indicates how fast and in which direction the particle is moving.
추천 영상:
Escape Velocity
Acceleration
Acceleration is the rate of change of velocity over time, indicating how quickly an object is speeding up or slowing down. It is also a vector quantity and is measured in units like meters per second squared (m/s²). On a velocity-time graph, the slope of the line represents the acceleration; a steeper slope indicates greater acceleration.
추천 영상:
Intro to Acceleration
Position from Velocity-Time Graph
The position of a particle can be determined from its velocity-time graph by calculating the area under the velocity curve. Each segment of the graph corresponds to a specific time interval, and the area represents the displacement during that interval. By integrating the velocity over time, one can find the total change in position from the initial position.
추천 영상:
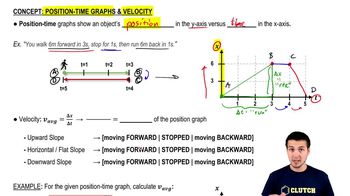
Intro to Position-Time Graphs & Velocity
관련 실천
교과서 질문
1870
views
교과서 질문
FIGURE EX2.8 showed the velocity graph of blood in the aorta. What is the blood's acceleration during each phase of the motion, speeding up and slowing down?
1231
views
교과서 질문
What constant acceleration, in SI units, must a car have to go from zero to 60 mph in 10 s?
1913
views
교과서 질문
FIGURE EX2.9 shows the velocity graph of a particle. Draw the particle's acceleration graph for the interval 0 s ≤ t ≤ 4 s.
1394
views
교과서 질문
FIGURE EX2.12 shows the velocity-versus-time graph for a particle moving along the x-axis. Its initial position is at x0 = 2 m at t0 = 0 s. What are the particle's position, velocity, and acceleration at t = 3.0 s?
1512
views
교과서 질문
How far has the car traveled when it reaches 60 mph? Give your answer both in SI units and in feet.
1908
views