Ch 39: Wave Functions and Uncertainty
Knight Calc - Physics for Scientists and Engineers 5th Edition
Knight Calc5th EditionPhysics for Scientists and EngineersISBN: 9780137344796당신이 사용하는 게 아니라요?교과서 변경
39장, 문제 16b

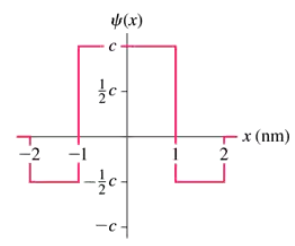
FIGURE EX39.16 shows the wave function of an electron. Draw a graph of |ψ(x)|2.

검증된 단계별 안내
1
Step 1: Understand the problem. The wave function ψ(x) represents the quantum state of an electron, and |ψ(x)|^2 is the probability density function. This means that |ψ(x)|^2 gives the probability of finding the electron at a specific position x. To draw the graph of |ψ(x)|^2, we need to square the magnitude of ψ(x) at each point along the x-axis.
Step 2: Analyze the given wave function ψ(x). Look at the graph provided in FIGURE EX39.16 and identify the key features of ψ(x), such as its amplitude, nodes (points where ψ(x) = 0), and regions of positive and negative values. These features will influence the shape of |ψ(x)|^2.
Step 3: Square the wave function. For each value of x, calculate |ψ(x)|^2 = ψ(x) × ψ*(x), where ψ*(x) is the complex conjugate of ψ(x). If ψ(x) is purely real, this simplifies to |ψ(x)|^2 = ψ(x)^2. Note that squaring the wave function removes any negative values, so the graph of |ψ(x)|^2 will only have positive values.
Step 4: Plot the graph. Using the squared values from Step 3, plot |ψ(x)|^2 as a function of x. Pay attention to the nodes (where ψ(x) = 0), as |ψ(x)|^2 will also be zero at these points. The peaks in the graph of |ψ(x)|^2 will correspond to the regions where ψ(x) has the highest amplitude.
Step 5: Label the graph. Clearly label the axes of the graph, with the x-axis representing position (x) and the y-axis representing |ψ(x)|^2 (probability density). Include any important features, such as nodes or regions of high probability density, to make the graph informative and accurate.

비슷한 문제에 대한 검증된 영상 답변:

이 영상 해법은 위 문제에 도움이 된다고 튜터들이 추천한 것입니다.
도움이 되었나요?

주요 개념

질문에 올바르게 답하기 위해 반드시 이해해야 하는 핵심 개념들은 다음과 같습니다.

Wave Function (ψ)

The wave function, denoted as ψ, is a fundamental concept in quantum mechanics that describes the quantum state of a particle, such as an electron. It contains all the information about the system and is a complex-valued function of position and time. The square of the absolute value of the wave function, |ψ(x)|^2, represents the probability density of finding the particle at a given position x.
추천 영상:
가이드 코스
08:30
Intro to Wave Functions

Probability Density

Probability density is a measure that describes the likelihood of finding a particle in a specific region of space. In quantum mechanics, it is calculated as the square of the wave function's absolute value, |ψ(x)|^2. This concept is crucial for interpreting the wave function, as it provides a statistical interpretation of the particle's position, allowing us to visualize where the electron is most likely to be found.
추천 영상:
가이드 코스
8:13
Intro to Density

Graphing Functions

Graphing functions involves plotting the values of a function on a coordinate system to visualize its behavior. In the context of |ψ(x)|^2, this means creating a graph where the x-axis represents position and the y-axis represents the probability density. Understanding how to graph functions is essential for analyzing quantum states and interpreting the spatial distribution of particles, such as electrons.
추천 영상:
가이드 코스
08:30
Intro to Wave Functions