Ch 19: The First Law of Thermodynamics
Young & Freedman Calc - University Physics 14th Edition
Young & Freedman Calc14th EditionUniversity PhysicsISBN: 9780321973610당신이 사용하는 게 아니라요?교과서 변경
19장, 문제 6a

A gas undergoes two processes. In the first, the volume remains constant at 0.2000.200 m3 and the pressure increases from 2.00×1052.00\(\times\)10^5 Pa to 5.00×1055.00\(\times\)10^5 Pa. The second process is a compression to a volume of 0.1200.120 m3 at a constant pressure of 5.00×1055.00\(\times\)10^5 Pa. In a pVpV-diagram, show both processes.

검증된 단계별 안내
1
Start by understanding the pV-diagram, which is a graphical representation of the pressure (p) versus volume (V) for a given process. In this problem, we have two distinct processes to represent.
For the first process, the volume remains constant at 0.200 m^3 while the pressure increases from 2.00 * 10^5 Pa to 5.00 * 10^5 Pa. On a pV-diagram, this is represented as a vertical line because the volume does not change, only the pressure does.
For the second process, the gas is compressed to a volume of 0.120 m^3 at a constant pressure of 5.00 * 10^5 Pa. On a pV-diagram, this is represented as a horizontal line because the pressure remains constant while the volume decreases.
To plot these processes on the pV-diagram, start by marking the initial point of the first process at (0.200 m^3, 2.00 * 10^5 Pa). Draw a vertical line up to the point (0.200 m^3, 5.00 * 10^5 Pa) to represent the first process.
Next, from the endpoint of the first process, draw a horizontal line to the point (0.120 m^3, 5.00 * 10^5 Pa) to represent the second process. This completes the representation of both processes on the pV-diagram.

비슷한 문제에 대한 검증된 영상 답변:

이 영상 해법은 위 문제에 도움이 된다고 튜터들이 추천한 것입니다.
영상 길이:
3m
도움이 되었나요?

주요 개념

질문에 올바르게 답하기 위해 반드시 이해해야 하는 핵심 개념들은 다음과 같습니다.

Pressure-Volume (pV) Diagram

A pV diagram is a graphical representation of the changes in pressure and volume of a gas during thermodynamic processes. It helps visualize how these properties interact, with pressure on the y-axis and volume on the x-axis. In this question, the diagram will show a vertical line for the constant volume process and a horizontal line for the constant pressure process.
추천 영상:
가이드 코스
08:07
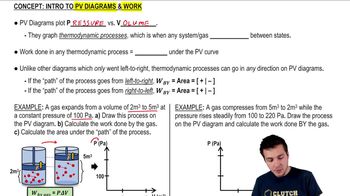
Work and PV Diagrams

Isovolumetric Process

An isovolumetric process, also known as an isochoric process, occurs when the volume of a system remains constant. During this process, any change in pressure is due to changes in temperature or the amount of gas. In the given question, the first process is isovolumetric, where the pressure increases while the volume remains at 0.200 m^3.
추천 영상:
가이드 코스
06:44
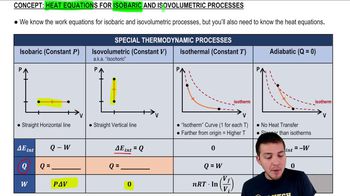
Heat Equations for Isobaric & Isovolumetric Processes

Isobaric Process

An isobaric process is a thermodynamic process in which the pressure remains constant while the volume changes. This type of process is represented by a horizontal line on a pV diagram. In the question, the second process is isobaric, where the gas is compressed to a volume of 0.120 m^3 while maintaining a constant pressure of 5.00 * 10^5 Pa.
추천 영상:
가이드 코스
06:44
Heat Equations for Isobaric & Isovolumetric Processes
관련 실천
교과서 질문

A gas undergoes two processes. In the first, the volume remains constant at 0.2000.200 m3 and the pressure increases from 2.00×1052.00\(\times\)10^5 Pa to 5.00×1055.00\(\times\)10^5 Pa. The second process is a compression to a volume of 0.1200.120 m3 at a constant pressure of 5.00×1055.00\(\times\)10^5 Pa. Find the total work done by the gas during both processes.

2420
views
2
rank
교과서 질문

The graph in Fig. E19.419.4 shows a pVpV-diagram of the air in a human lung when a person is inhaling and then exhaling a deep breath. Such graphs, obtained in clinical practice, are normally somewhat curved, but we have modeled one as a set of straight lines of the same general shape. (Important: The pressure shown is the gauge pressure, not the absolute pressure.) The process illustrated here is somewhat different from those we have been studying, because the pressure change is due to changes in the amount of gas in the lung, not to temperature changes. (Think of your own breathing. Your lungs do not expand because they've gotten hot.) If the temperature of the air in the lung remains a reasonable 20 20°C, what is the maximum number of moles in this person's lung during a breath?

2075
views
교과서 질문

Figure E19.819.8 shows a pVpV-diagram for an ideal gas in which its absolute temperature at bb is one-fourth of its absolute temperature at aa. Did heat enter or leave the gas from aa to bb? How do you know?

2562
views
교과서 질문

In Fig. 19.719.7a, consider the closed loop 132411 → 3 → 2 → 4 → 1. This is a cyclic process in which the initial and final states are the same. Find the total work done by the system in this cyclic process, and show that it is equal to the area enclosed by the loop.

3816
views
교과서 질문

The graph in Fig. E19.419.4 shows a pVpV-diagram of the air in a human lung when a person is inhaling and then exhaling a deep breath. Such graphs, obtained in clinical practice, are normally somewhat curved, but we have modeled one as a set of straight lines of the same general shape. (Important: The pressure shown is the gauge pressure, not the absolute pressure.) How many joules of net work does this person's lung do during one complete breath?

410
views
교과서 질문

Six moles of an ideal gas are in a cylinder fitted at one end with a movable piston. The initial temperature of the gas is 27.027.0°C and the pressure is constant. As part of a machine design project, calculate the final temperature of the gas after it has done 2.40×1032.40\(\times\)10^3 J of work.

2300
views
2
rank