Ch. 1 - Introduction to Statistics
Larson - Elementary Statistics: Picturing the World 8th Edition
Larson8th EditionElementary Statistics: Picturing the WorldISBN: 9780137493470당신이 사용하는 게 아니라요?교과서 변경
1장, 문제 1.2.25

The items below appear on a physician’s intake form. Determine the level of measurement of the data for each category.
         
a. Temperature
        
b. Allergies
        
c. Weight
        
d. Pain level (scale of 0 to 10)

검증된 단계별 안내
1
Step 1: Understand the four levels of measurement in statistics: Nominal, Ordinal, Interval, and Ratio. Nominal data is categorical without a meaningful order, Ordinal data has a meaningful order but no consistent difference between values, Interval data has consistent differences but no true zero, and Ratio data has consistent differences and a true zero point.
Step 2: Analyze the first category, 'Temperature'. Temperature is measured on an interval scale because it has consistent differences between values (e.g., 1 degree difference is the same across the scale), but it does not have a true zero (e.g., 0 degrees does not mean 'no temperature').
Step 3: Analyze the second category, 'Allergies'. Allergies are nominal data because they are categorical and do not have a meaningful order (e.g., peanut allergy is not 'greater' or 'less' than pollen allergy).
Step 4: Analyze the third category, 'Weight'. Weight is measured on a ratio scale because it has consistent differences between values and a true zero point (e.g., 0 weight means no weight).
Step 5: Analyze the fourth category, 'Pain level (scale of 0 to 10)'. Pain level is ordinal data because the values have a meaningful order (e.g., 5 indicates more pain than 3), but the differences between values are not necessarily consistent (e.g., the difference in pain between 2 and 3 may not be the same as between 7 and 8).

비슷한 문제에 대한 검증된 영상 답변:

이 영상 해법은 위 문제에 도움이 된다고 튜터들이 추천한 것입니다.
영상 길이:
3m
도움이 되었나요?

주요 개념

질문에 올바르게 답하기 위해 반드시 이해해야 하는 핵심 개념들은 다음과 같습니다.

Levels of Measurement

Levels of measurement refer to the different ways data can be categorized and quantified. There are four primary levels: nominal, ordinal, interval, and ratio. Each level has distinct characteristics that determine how data can be analyzed and interpreted. Understanding these levels is crucial for correctly identifying the nature of the data in the given categories.
추천 영상:
10:28
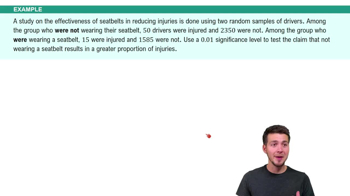
Difference in Proportions: Hypothesis Tests Example 1

Nominal and Ordinal Data

Nominal data represent categories without any inherent order, such as the presence or absence of allergies. Ordinal data, on the other hand, involve categories with a meaningful order but no consistent difference between them, like pain levels rated from 0 to 10. Recognizing the difference between these types is essential for determining how to analyze and interpret the data accurately.
추천 영상:
04:39
Visualizing Qualitative vs. Quantitative Data

Interval and Ratio Data

Interval data have meaningful differences between values but lack a true zero point, while ratio data possess both meaningful differences and a true zero, allowing for the comparison of absolute magnitudes. For example, temperature can be considered interval data, whereas weight is ratio data. Understanding these distinctions helps in selecting appropriate statistical methods for analysis.
추천 영상:
04:39
Visualizing Qualitative vs. Quantitative Data
관련 실천
교과서 질문

Name each level of measurement for which data can be qualitative.

195
views

교과서 질문

Determine whether the data are qualitative or quantitative, and determine the level of measurement of the data set.

The top six final scores at the 2021 U.S. Women’s Figure Skating Championships are listed. (Source: NBC Sports)

232.61 215.33 214.98 213.39 199.95 178.89

212
views
교과서 질문

Determine whether the number describes a population parameter or a sample statistic. Explain your reasoning.

Voter registration records show that 47% of all voters in a county are registered as Democrats.

220
views
교과서 질문

A researcher wants to study the effects of sleep deprivation on motor skills. Eighteen people volunteer for the experiment: Jake, Arya, Xavier, Nyla, Shaniece, Chen, Juan, Hana, Nia, Ansel, Liam, Bruno, Mei, Zoey, Kayla, Liam, Sofia, and Kai. Use a random number generator to choose nine subjects for the treatment group. The other nine subjects will go into the control group. List the subjects in each group. Tell which method you used to generate the random numbers.

114
views
교과서 질문

Identify the sampling technique used, and discuss potential sources of bias (if any). Explain.

Soybeans are planted on a 48-acre field. The field is divided into one-acre subplots. A sample is taken from each subplot to estimate the harvest.

218
views
교과서 질문

Determine whether the data are qualitative or quantitative. Explain your reasoning.

Ages of dogs at a rescue facility

207
views