Ch. 2 - Descriptive Statistics
Larson - Elementary Statistics: Picturing the World 8th Edition
Larson8th EditionElementary Statistics: Picturing the WorldISBN: 9780137493470당신이 사용하는 게 아니라요?교과서 변경
2장, 문제 2.R.28

In Exercises 27 and 28, find the range, mean, variance, and standard deviation of the sample data set.


Salaries (in dollars) of a random sample of teachers
62,222 56,719 50,259 45,120 47,692 45,985 53,489 71,534

검증된 단계별 안내
1
Step 1: Calculate the range of the data set. The range is the difference between the maximum and minimum values in the data set. Identify the maximum value (71,534) and the minimum value (45,120), then compute the range as Range = Max - Min.
Step 2: Calculate the mean (average) of the data set. Add all the salary values together and divide by the total number of data points. Use the formula: Mean = (Σx) / n, where Σx is the sum of all data points and n is the number of data points.
Step 3: Compute the variance of the sample. First, subtract the mean from each data point to find the deviation of each value. Then square each deviation, sum them up, and divide by (n - 1), where n is the number of data points. Use the formula: Variance = (Σ(x - Mean)²) / (n - 1).
Step 4: Calculate the standard deviation of the sample. The standard deviation is the square root of the variance. Use the formula: Standard Deviation = √Variance.
Step 5: Summarize the results. Report the range, mean, variance, and standard deviation of the sample data set, ensuring all calculations are accurate and clearly presented.

비슷한 문제에 대한 검증된 영상 답변:

이 영상 해법은 위 문제에 도움이 된다고 튜터들이 추천한 것입니다.
영상 길이:
3m
도움이 되었나요?

주요 개념

질문에 올바르게 답하기 위해 반드시 이해해야 하는 핵심 개념들은 다음과 같습니다.

Descriptive Statistics

Descriptive statistics summarize and describe the main features of a data set. This includes measures such as the mean (average), variance (measure of data spread), and standard deviation (average distance from the mean). These statistics provide a quick overview of the data's central tendency and variability, which are essential for understanding the overall distribution of the sample.
추천 영상:
가이드 코스
05:53
Parameters vs. Statistics

Range

The range is a simple measure of variability that indicates the difference between the highest and lowest values in a data set. It provides a quick sense of the spread of the data but does not account for how the values are distributed within that range. In the context of the given salaries, calculating the range helps to understand the extent of salary variation among the sampled teachers.
추천 영상:
가이드 코스
05:45
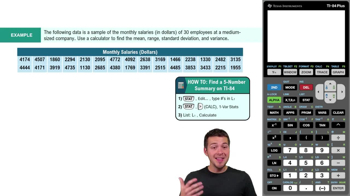
Find 5-Number Summary - TI-84 Calculator Example 1

Variance and Standard Deviation

Variance measures how far each number in the data set is from the mean and thus from every other number. It is calculated as the average of the squared differences from the mean. Standard deviation, the square root of variance, provides a more interpretable measure of spread in the same units as the data. Both are crucial for assessing the consistency and reliability of the data set.
추천 영상:
가이드 코스
08:45
Calculating Standard Deviation