Ch. 2 - Descriptive Statistics
Larson - Elementary Statistics: Picturing the World 8th Edition
Larson8th EditionElementary Statistics: Picturing the WorldISBN: 9780137493470당신이 사용하는 게 아니라요?교과서 변경
2장, 문제 2.1.21

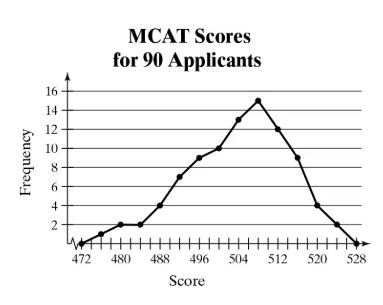
use the frequency polygon to identify the class with the greatest, and the class with the least, frequency.
Line graph showing MCAT score frequencies for 90 applicants, peaking at score 512 with highest frequency 15.

검증된 단계별 안내
1
Step 1: Understand the graph type. A frequency polygon is a line graph that shows the frequencies of different classes or intervals. Here, the x-axis represents MCAT scores, and the y-axis represents the frequency of applicants with those scores.
Step 2: Identify the classes (score intervals) on the x-axis. Each point on the graph corresponds to a specific score or score range, and the height of the point shows how many applicants scored in that range.
Step 3: Locate the highest point on the frequency polygon. This point corresponds to the class with the greatest frequency. From the graph, observe which score has the highest frequency value on the y-axis.
Step 4: Locate the lowest point on the frequency polygon (excluding zero frequency if any). This point corresponds to the class with the least frequency. Check the points near the edges or where the line is closest to the x-axis.
Step 5: Record the score classes corresponding to these highest and lowest points. These classes represent the scores with the greatest and least number of applicants, respectively.

비슷한 문제에 대한 검증된 영상 답변:

이 영상 해법은 위 문제에 도움이 된다고 튜터들이 추천한 것입니다.
영상 길이:
4m
도움이 되었나요?

주요 개념

질문에 올바르게 답하기 위해 반드시 이해해야 하는 핵심 개념들은 다음과 같습니다.

Frequency Polygon

A frequency polygon is a graphical representation of a frequency distribution. It is created by plotting points corresponding to class midpoints and their frequencies, then connecting these points with straight lines. This helps visualize the shape and spread of the data, making it easier to identify peaks and trends.
추천 영상:
04:41
Creating Frequency Polygons

Class Frequency

Class frequency refers to the number of data points that fall within a specific class or interval. In a frequency polygon, the height of each point represents the frequency of that class. Identifying the class with the greatest or least frequency involves finding the highest or lowest points on the graph.
추천 영상:
04:41
Creating Frequency Polygons

Interpreting Graphs to Identify Extremes

Interpreting graphs involves analyzing visual data to extract meaningful information, such as identifying maximum and minimum values. In this context, the class with the greatest frequency corresponds to the highest point on the frequency polygon, while the class with the least frequency corresponds to the lowest point, excluding zero frequencies.
추천 영상:
04:36
Time-Series Graphs Example 1