Ch. 2 - Descriptive Statistics
Larson - Elementary Statistics: Picturing the World 8th Edition
Larson8th EditionElementary Statistics: Picturing the WorldISBN: 9780137493470당신이 사용하는 게 아니라요?교과서 변경
2장, 문제 2.5.60

Modified Box-and-Whisker Plot In Exercises 59–62, (a) identify any outliers and (b) draw a modified box-and-whisker plot that represents the data set. Use asterisks (*) to identify outliers.


75 78 80 75 62 72 74 75 80 95 76 72

검증된 단계별 안내
1
Step 1: Organize the data set in ascending order: {62, 72, 72, 74, 75, 75, 75, 76, 78, 80, 80, 95}.
Step 2: Calculate the five-number summary: minimum, first quartile (Q1), median (Q2), third quartile (Q3), and maximum. Use the formulas for Q1 and Q3 based on the position of the data points in the ordered set.
Step 3: Determine the interquartile range (IQR) using the formula IQR = Q3 - Q1. Then, calculate the lower and upper bounds for outliers using the formulas: Lower Bound = Q1 - 1.5 * IQR and Upper Bound = Q3 + 1.5 * IQR.
Step 4: Identify any data points that fall below the lower bound or above the upper bound. These points are considered outliers and should be marked with asterisks (*) in the modified box-and-whisker plot.
Step 5: Draw the modified box-and-whisker plot. Represent the five-number summary with a box and whiskers, and use asterisks (*) to indicate any outliers identified in Step 4.

비슷한 문제에 대한 검증된 영상 답변:

이 영상 해법은 위 문제에 도움이 된다고 튜터들이 추천한 것입니다.
영상 길이:
4m
도움이 되었나요?

주요 개념

질문에 올바르게 답하기 위해 반드시 이해해야 하는 핵심 개념들은 다음과 같습니다.

Outliers

Outliers are data points that significantly differ from other observations in a dataset. They can skew the results of statistical analyses and may indicate variability in measurement, experimental errors, or novel phenomena. In a box-and-whisker plot, outliers are typically identified as points that lie beyond 1.5 times the interquartile range (IQR) from the quartiles.
추천 영상:
가이드 코스
04:48
Comparing Mean vs. Median

Box-and-Whisker Plot

A box-and-whisker plot is a graphical representation of a dataset that displays its central tendency and variability. It consists of a box that represents the interquartile range (IQR), with lines (whiskers) extending to the minimum and maximum values within 1.5 times the IQR. This plot helps visualize the distribution of data, including the median, quartiles, and potential outliers.
추천 영상:
가이드 코스
07:38
Residuals and Residual Plots

Interquartile Range (IQR)

The interquartile range (IQR) is a measure of statistical dispersion that represents the range within which the central 50% of the data lies. It is calculated by subtracting the first quartile (Q1) from the third quartile (Q3). The IQR is crucial for identifying outliers and understanding the spread of the data, as it is less affected by extreme values than the overall range.
추천 영상:
가이드 코스
05:45
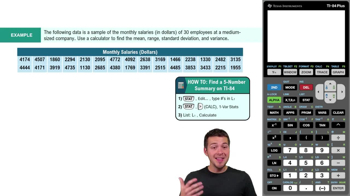
Find 5-Number Summary - TI-84 Calculator Example 1