Ch. 3 - Probability
Larson - Elementary Statistics: Picturing the World 8th Edition
Larson8th EditionElementary Statistics: Picturing the WorldISBN: 9780137493470당신이 사용하는 게 아니라요?교과서 변경
3장, 문제 3.3.7

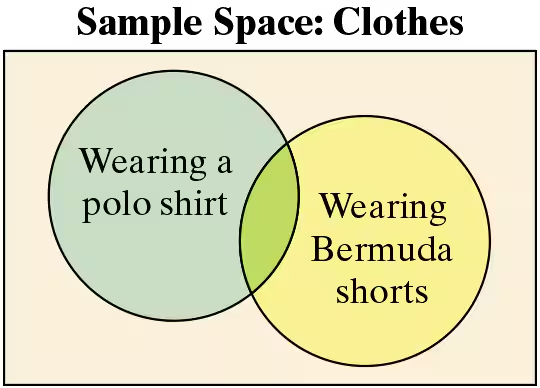
Graphical Analysis In Exercises 7 and 8, determine whether the events shown in the Venn diagram are mutually exclusive. Explain your reasoning.
Venn diagram showing clothing options: wearing a polo shirt and wearing Bermuda shorts, with overlapping areas indicated.

검증된 단계별 안내
1
Step 1: Understand the concept of mutually exclusive events. Two events are mutually exclusive if they cannot occur at the same time. In other words, their intersection is empty, meaning there are no outcomes that belong to both events.
Step 2: Analyze the Venn diagram provided. The diagram shows two events: 'Wearing a polo shirt' and 'Wearing Bermuda shorts.' The sample space represents all possible clothing combinations.
Step 3: Observe the intersection of the two circles in the Venn diagram. The overlapping region indicates that there are outcomes where both events occur simultaneously, i.e., a person can wear both a polo shirt and Bermuda shorts at the same time.
Step 4: Based on the presence of the intersection, conclude that the events are not mutually exclusive. The existence of shared outcomes means the events can occur together.
Step 5: Explain the reasoning clearly: Since the Venn diagram shows an overlap between the two events, they are not mutually exclusive. Mutually exclusive events would have no overlap in the diagram.

비슷한 문제에 대한 검증된 영상 답변:

이 영상 해법은 위 문제에 도움이 된다고 튜터들이 추천한 것입니다.
영상 길이:
2m
도움이 되었나요?

주요 개념

질문에 올바르게 답하기 위해 반드시 이해해야 하는 핵심 개념들은 다음과 같습니다.

Mutually Exclusive Events

Mutually exclusive events are those that cannot occur at the same time. In probability, if one event happens, the other cannot. For example, if you are wearing a polo shirt, you cannot simultaneously be wearing Bermuda shorts if they are defined as mutually exclusive options.
추천 영상:
5:14
Probability of Mutually Exclusive Events

Venn Diagrams

Venn diagrams are graphical representations used to show the relationships between different sets. In this context, the circles represent the sets of clothing options, with overlapping areas indicating that some outcomes can belong to both sets, which is crucial for determining if the events are mutually exclusive.
추천 영상:
5:14
Probability of Mutually Exclusive Events

Sample Space

The sample space is the set of all possible outcomes in a probability experiment. In this case, the sample space consists of all clothing combinations, and understanding it helps in analyzing the events represented in the Venn diagram to determine their exclusivity.
추천 영상:
05:11
Sampling Distribution of Sample Proportion
관련 실천
교과서 질문

Using a Pie Chart to Find Probabilities In Exercises 83-86, use the pie chart at the left, which shows the number of workers (in millions) by occupation for the United States. (Source: U.S. Bureau of Labor Statistics)

84. Find the probability that a worker chosen at random is not employed in a service occupation.

" style="" width="260">

126
views
교과서 질문

25. Playlist A band is preparing a setlist of 21 songs for a concert. How many different ways can the band play the first six songs?

129
views
교과서 질문

Odds The chances of winning are often written in terms of odds rather than probabilities. The odds of winning is the ratio of the number of successful outcomes to the number of unsuccessful outcomes. The odds of losing is the ratio of the number of unsuccessful outcomes to the number of successful outcomes. For example, when the number of successful outcomes is 2 and the number of unsuccessful outcomes is 3, the odds of winning are 2 : 3 (read "2 to 3"). In Exercises 91-96, use this information about odds.

92. The probability of winning an instant prize game is 1/10. The odds of winning a different instant prize game are 1 : 10. You want the best chance of winning. Which game should you play? Explain your reasoning.

61
views
교과서 질문

Finding Classical Probabilities In Exercises 41-46, a probability experiment consists of rolling a 12-sided die numbered 1 to 12. Find the probability of the event.

46. Event F: rolling a number divisible by 5

120
views
교과서 질문

True or False? In Exercises 3-6, determine whether the statement is true or false. If it is false,

explain why.

4. When two events are independent, they are also mutually exclusive.

150
views
교과서 질문

Identifying the Sample Space of a Probability Experiment In Exercises 25-32, identify the sample space of the probability experiment and determine the number of outcomes in the sample space. Draw a tree diagram when appropriate.

25. Guessing the initial of a student's middle name

160
views