Ch. 3 - Probability
Larson - Elementary Statistics: Picturing the World 8th Edition
Larson8th EditionElementary Statistics: Picturing the WorldISBN: 9780137493470당신이 사용하는 게 아니라요?교과서 변경
3장, 문제 3.CR.14c

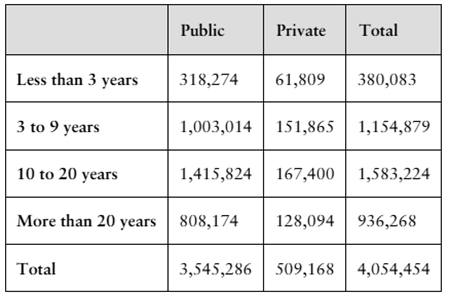
The table shows the results of a survey in which 3,545,286 public and 509,168 private school teachers were asked about their full-time teaching experience.
Table showing teaching experience of public and private school teachers with counts across four experience ranges and totals.
Are the events “being a public school teacher” and “having more than 20 years of full-time teaching experience” independent? Explain.

검증된 단계별 안내
1
Identify the two events: A = "being a public school teacher" and B = "having more than 20 years of full-time teaching experience."
Calculate the probability of event A, \(P(A)\), by dividing the total number of public school teachers by the total number of teachers surveyed: \(P(A) = \frac{3,545,286}{4,054,454}\).
Calculate the probability of event B, \(P(B)\), by dividing the total number of teachers with more than 20 years of experience by the total number of teachers surveyed: \(P(B) = \frac{936,268}{4,054,454}\).
Calculate the joint probability of both events occurring together, \(P(A \cap B)\), by dividing the number of public school teachers with more than 20 years of experience by the total number of teachers surveyed: \(P(A \cap B) = \frac{808,174}{4,054,454}\).
Check for independence by verifying if \(P(A \cap B) = P(A) \times P(B)\). If this equality holds, the events are independent; otherwise, they are dependent.

비슷한 문제에 대한 검증된 영상 답변:

이 영상 해법은 위 문제에 도움이 된다고 튜터들이 추천한 것입니다.
영상 길이:
4m

주요 개념

질문에 올바르게 답하기 위해 반드시 이해해야 하는 핵심 개념들은 다음과 같습니다.

Independence of Events

Two events are independent if the occurrence of one does not affect the probability of the other. Mathematically, events A and B are independent if P(A ∩ B) = P(A) × P(B). In this context, we check if being a public school teacher and having more than 20 years of experience occur independently.
추천 영상:
가이드 코스
05:54
Probability of Multiple Independent Events

Joint and Marginal Probabilities

Joint probability is the probability of two events happening together, while marginal probability is the probability of a single event regardless of the other. To test independence, we calculate the joint probability of both events and compare it to the product of their marginal probabilities.
추천 영상:
가이드 코스
5:37
Introduction to Probability

Using Contingency Tables for Probability

Contingency tables display frequencies of categorical variables and help calculate probabilities. By dividing counts by the total sample size, we find probabilities for each category and their combinations, which are essential for testing independence between variables.
추천 영상:
가이드 코스
08:18
Contingency Tables & Expected Frequencies
관련 실천
교과서 질문

31. Experiment A researcher is randomly selecting a treatment group of 10 human subjects from a group of 20 people taking part in an experiment. In how many different ways can the treatment group be selected?

182
views

교과서 질문

In Exercises 15-18, determine whether the situation involves permutations, combinations, or neither. Explain your reasoning.

15. The number of ways 16 floats can line up in a row for a parade

89
views
교과서 질문

Using a Frequency Distribution to Find Probabilities In Exercises 49-52, use the frequency distribution at the left, which shows the population of the United States by age group, to find the probability that a U.S. resident chosen at random is in the age range. (Source: U.S. Census Bureau)

49. 18 to 24 years old

134
views
교과서 질문

4. Determine whether the events are mutually exclusive. Then determine whether the events are independent or dependent. Explain your reasoning.

Event A: A bowler having the highest game in a 40-game tournament

Event B: Losing the bowling tournament

134
views
교과서 질문

The table shows the numbers (in thousands) of earned degrees by level in two different fields, conferred in the United States in a recent year. (Source: U.S. National Center for Education Statistics)

A person who earned a degree in the year is randomly selected. Find the probability that the degree earned by the person is a

a. bachelor's degree.

84
views
교과서 질문

The table shows the numbers (in thousands) of earned degrees by level in two different fields, conferred in the United States in a recent year. (Source: U.S. National Center for Education Statistics)

A person who earned a degree in the year is randomly selected. Find the probability that the degree earned by the person is a

g. bachelor's degree and the degree is in natural sciences/mathematics.

68
views