Ch. 3 - Probability
Larson - Elementary Statistics: Picturing the World 8th Edition
Larson8th EditionElementary Statistics: Picturing the WorldISBN: 9780137493470당신이 사용하는 게 아니라요?교과서 변경
3장, 문제 3.1.68

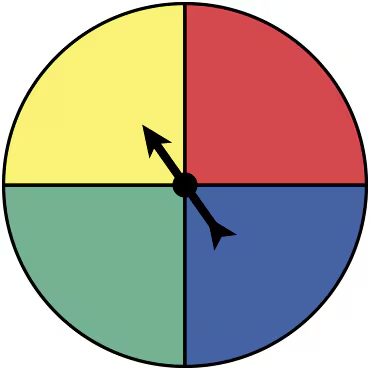
Using a Tree Diagram In Exercises 67-70, a probability experiment consists of rolling a six-sided die and spinning the spinner shown at the left. The spinner is equally likely to land on each color. Use a tree diagram to find the probability of the event. Then explain whether the event can be considered unusual.
68. Event B: rolling an odd number and the spinner landing on green
A circular spinner divided into four equal sections colored yellow, red, green, and blue, with an arrow pointing to yellow.

검증된 단계별 안내
1
Step 1: Understand the problem. The experiment involves rolling a six-sided die and spinning a spinner with four equally likely colors: yellow, red, green, and blue. Event B is defined as rolling an odd number and the spinner landing on green.
Step 2: Identify the outcomes for rolling the die. A six-sided die has outcomes {1, 2, 3, 4, 5, 6}. Odd numbers are {1, 3, 5}, so there are 3 favorable outcomes for rolling an odd number.
Step 3: Identify the outcomes for the spinner. The spinner has 4 equally likely outcomes: yellow, red, green, and blue. The favorable outcome for Event B is the spinner landing on green, which is 1 out of 4 outcomes.
Step 4: Use a tree diagram to represent the combined outcomes. For each roll of the die (1, 2, 3, 4, 5, 6), draw branches for each spinner outcome (yellow, red, green, blue). Highlight the branches where the die roll is odd (1, 3, 5) and the spinner lands on green.
Step 5: Calculate the probability of Event B. Multiply the probability of rolling an odd number (3/6) by the probability of the spinner landing on green (1/4). This gives the probability of Event B. To determine if the event is unusual, compare the probability to a threshold (e.g., less than 0.05 is considered unusual).

비슷한 문제에 대한 검증된 영상 답변:

이 영상 해법은 위 문제에 도움이 된다고 튜터들이 추천한 것입니다.
영상 길이:
2m
도움이 되었나요?

주요 개념

질문에 올바르게 답하기 위해 반드시 이해해야 하는 핵심 개념들은 다음과 같습니다.

Tree Diagram

A tree diagram is a visual representation used to illustrate all possible outcomes of a probability experiment. Each branch represents a possible outcome from a decision or event, allowing for a systematic way to calculate probabilities. In this case, the tree diagram will show the outcomes of rolling a die and spinning a spinner, helping to visualize the combined events.
추천 영상:
5:14
Probability of Mutually Exclusive Events

Probability of Events

Probability quantifies the likelihood of an event occurring, expressed as a number between 0 and 1. For the given experiment, the probability of rolling an odd number (1, 3, or 5) and landing on green can be calculated by identifying the favorable outcomes over the total possible outcomes. Understanding how to calculate these probabilities is essential for determining whether the event is unusual.
추천 영상:
05:54
Probability of Multiple Independent Events

Unusual Events

An event is considered unusual if its probability is significantly low, typically defined as less than 5%. In this context, after calculating the probability of rolling an odd number and landing on green, one must assess whether this probability falls below the threshold to classify the event as unusual. This concept helps in understanding the significance of certain outcomes in probability.
추천 영상:
05:54
Probability of Multiple Independent Events