Ch. 4 - Discrete Probability Distributions
Larson - Elementary Statistics: Picturing the World 8th Edition
Larson8th EditionElementary Statistics: Picturing the WorldISBN: 9780137493470당신이 사용하는 게 아니라요?교과서 변경
4장, 문제 4.1.3

Is the expected value of the probability distribution of a random variable always one of the possible values of x? Explain.v

검증된 단계별 안내
1
Understand the concept of expected value: The expected value (E[X]) of a random variable X is a weighted average of all possible values of X, where the weights are the probabilities associated with each value. It is calculated using the formula: E[X] = Σ (xᵢ * P(xᵢ)), where xᵢ represents the possible values of X and P(xᵢ) is the probability of xᵢ.
Recognize that the expected value is not necessarily one of the possible values of X: Since the expected value is a weighted average, it can be a value that does not correspond to any specific xᵢ in the probability distribution. For example, if the probabilities and values are distributed in such a way that the average lies between two possible values, the expected value will not match any specific xᵢ.
Consider an example to illustrate: Suppose a random variable X has possible values {1, 2, 3} with probabilities {0.2, 0.5, 0.3}. The expected value is calculated as E[X] = (1 * 0.2) + (2 * 0.5) + (3 * 0.3). The result may not be exactly 1, 2, or 3, but rather a value in between.
Understand the implications: The expected value represents the 'center' or 'balance point' of the probability distribution, but it does not have to correspond to an actual observed value of the random variable. This is a key distinction between the expected value and the mode or median, which may correspond to actual observed values.
Conclude with the answer: No, the expected value of a probability distribution is not always one of the possible values of X. It depends on the specific probabilities and values in the distribution, and it is often a value that lies between the possible values of X.

비슷한 문제에 대한 검증된 영상 답변:

이 영상 해법은 위 문제에 도움이 된다고 튜터들이 추천한 것입니다.
영상 길이:
1m
도움이 되었나요?

주요 개념

질문에 올바르게 답하기 위해 반드시 이해해야 하는 핵심 개념들은 다음과 같습니다.

Expected Value

The expected value of a random variable is a measure of the central tendency of its probability distribution. It is calculated as the weighted average of all possible values, where each value is weighted by its probability of occurrence. The expected value provides a single summary statistic that represents the long-term average outcome of a random process.
추천 영상:
가이드 코스
04:14
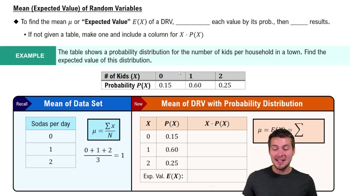
Expected Value (Mean) of Random Variables

Probability Distribution

A probability distribution describes how the probabilities of a random variable are distributed across its possible values. It can be represented in various forms, such as a probability mass function for discrete variables or a probability density function for continuous variables. Understanding the shape and characteristics of a probability distribution is crucial for interpreting the expected value and other statistical measures.
추천 영상:
가이드 코스
06:39
Calculating Probabilities in a Binomial Distribution

Random Variable

A random variable is a numerical outcome of a random phenomenon, which can take on different values based on the outcome of a random process. Random variables can be classified as discrete, taking on specific values, or continuous, taking on any value within a range. The expected value of a random variable does not have to be one of its possible values; it can be a theoretical average that may not correspond to any actual outcome.
추천 영상:
가이드 코스
07:09
Intro to Random Variables & Probability Distributions