


Ch. 4 - Discrete Probability Distributions
Larson - Elementary Statistics: Picturing the World 8th Edition
Larson8th EditionElementary Statistics: Picturing the WorldISBN: 9780137493470당신이 사용하는 게 아니라요?교과서 변경
4장, 문제 4.1.7

"True or False? In Exercises 5–8, determine whether the statement is true or false. If it is false, rewrite it as a true statement.


The mean of the random variable of a probability distribution describes how the outcomes vary."

검증된 단계별 안내
1
Step 1: Understand the concept of the mean in a probability distribution. The mean (also called the expected value) of a random variable in a probability distribution represents the central tendency or the average value of the outcomes, weighted by their probabilities.
Step 2: Clarify the statement provided. The statement claims that the mean describes how the outcomes vary. This is incorrect because the mean does not describe variability; it describes the central location of the distribution.
Step 3: Introduce the correct term for variability. The measure that describes how the outcomes vary is the variance or standard deviation, not the mean. Variance quantifies the spread of the outcomes around the mean.
Step 4: Rewrite the statement as a true statement. A correct version of the statement would be: 'The mean of the random variable of a probability distribution describes the central tendency of the outcomes, not their variability.'
Step 5: Summarize the distinction between mean and measures of variability. The mean provides information about the average outcome, while measures like variance and standard deviation provide information about the spread or variability of the outcomes.

비슷한 문제에 대한 검증된 영상 답변:

이 영상 해법은 위 문제에 도움이 된다고 튜터들이 추천한 것입니다.
영상 길이:
1m
도움이 되었나요?

주요 개념

질문에 올바르게 답하기 위해 반드시 이해해야 하는 핵심 개념들은 다음과 같습니다.

Mean of a Probability Distribution

The mean of a probability distribution, also known as the expected value, represents the average outcome of a random variable when considering all possible values weighted by their probabilities. It provides a central point around which the values of the random variable are distributed, but it does not indicate how much the outcomes vary.
추천 영상:
06:53
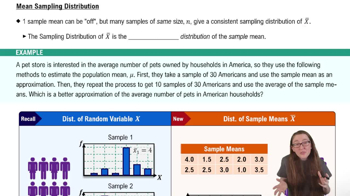
Sampling Distribution of Sample Mean

Variance and Standard Deviation

Variance measures the spread of a set of values in a probability distribution, indicating how much the outcomes differ from the mean. The standard deviation, the square root of variance, provides a more interpretable measure of variability, showing the average distance of each outcome from the mean. Together, these concepts help describe the distribution's variability.
추천 영상:
가이드 코스
08:45
Calculating Standard Deviation

Random Variable

A random variable is a numerical outcome of a random phenomenon, which can be discrete (taking specific values) or continuous (taking any value within a range). Understanding random variables is crucial for analyzing probability distributions, as they form the basis for calculating probabilities, means, and variances.
추천 영상:
가이드 코스
07:09
Intro to Random Variables & Probability Distributions