

Ch. 9 - Correlation and Regression
Larson - Elementary Statistics: Picturing the World 8th Edition
Larson8th EditionElementary Statistics: Picturing the WorldISBN: 9780137493470당신이 사용하는 게 아니라요?교과서 변경
9장, 문제 9.2.3

3. Explain how to predict y-values using the equation of a regression line.

검증된 단계별 안내
1
Understand that the equation of a regression line is typically written as y = b0 + b1x, where b0 is the y-intercept and b1 is the slope of the line.
Identify the value of x for which you want to predict the corresponding y-value. This x is the independent variable or predictor.
Substitute the chosen x-value into the regression equation in place of x.
Perform the arithmetic operations: multiply the slope b1 by the x-value, then add the y-intercept b0 to this product.
The result of this calculation gives the predicted y-value, which is the estimated value of the dependent variable based on the regression model.

비슷한 문제에 대한 검증된 영상 답변:

이 영상 해법은 위 문제에 도움이 된다고 튜터들이 추천한 것입니다.
영상 길이:
1m
도움이 되었나요?

주요 개념

질문에 올바르게 답하기 위해 반드시 이해해야 하는 핵심 개념들은 다음과 같습니다.

Regression Line Equation

The regression line equation is typically written as y = mx + b, where y is the predicted value, x is the independent variable, m is the slope, and b is the y-intercept. This equation models the relationship between variables and is used to estimate y for given x values.
추천 영상:
가이드 코스
04:57
Using Regression Lines to Predict Values

Slope and Intercept Interpretation

The slope (m) indicates the rate of change in y for each unit increase in x, showing the strength and direction of the relationship. The intercept (b) represents the predicted value of y when x is zero, providing a starting point for predictions.
추천 영상:
07:10
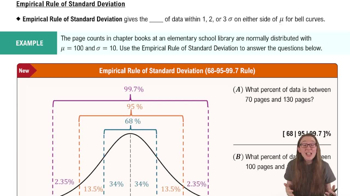
Empirical Rule of Standard Deviation and Range Rule of Thumb

Using the Equation for Prediction

To predict y-values, substitute the given x-value into the regression equation and solve for y. This process allows estimation of the dependent variable based on the independent variable, assuming the linear relationship holds.
추천 영상:
가이드 코스
09:00
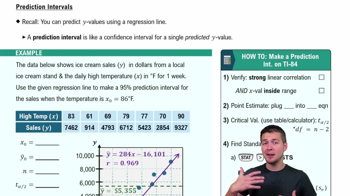
Prediction Intervals
관련 실천
교과서 질문

"Constructing and Interpreting a Prediction Interval In Exercises 21-30, construct the indicated prediction interval and interpret the results.

27. Natural Gas Construct a 95% prediction interval for the export of natural gas from the United States in Exercise 17 when the marketed production of natural gas in the United States is 31 trillion cubic feet."

51
views
교과서 질문

"Old Vehicles In Exercises 31–34, use the figure shown at the left.

Scatter Plot Construct a scatter plot of the data. Show y and x on the graph."

50
views
교과서 질문

4. Give examples of two variables that have perfect positive linear correlation and two variables that have perfect negative linear correlation.

131
views
교과서 질문

"In Exercises 19-22, two variables are given that have been shown to have correlation but no cause-and-effect relationship. Describe at least one possible reason for the correlation.

19. Value of home and life span"

59
views
교과서 질문

"Old Vehicles In Exercises 31–34, use the figure shown at the left.

Regression Line Find and draw the regression line."

37
views
교과서 질문

"Predicting y-Values In Exercises 3-6, use the multiple regression equation to predict the y-values for the values of the independent variables.

4. Sorghum Yield The equation used to predict the annual sorghum yield (in bushels per

acre) is y = 80.1-20.2x_1 +21.2x_2

where x_1 is the number of acres planted (in millions) and x_2 is the number of acres harvested (in millions). (Adapted from United States Department of Agriculture)

a. x_1 = 5.5, x_2 = 3.9

b. x_1 = 8.3, x_2 = 7.3

c. x_1 = 6.5, x_2 = 5.7

d. x_1 = 9.4, x_2= 7.8"

39
views