


Ch. 9 - Correlation and Regression
Larson - Elementary Statistics: Picturing the World 8th Edition
Larson8th EditionElementary Statistics: Picturing the WorldISBN: 9780137493470당신이 사용하는 게 아니라요?교과서 변경
9장, 문제 9.3.31

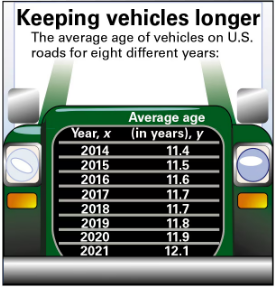
"Old Vehicles In Exercises 31–34, use the figure shown at the left.
Table showing the average age of vehicles on U.S. roads from 2014 to 2021, with years and corresponding ages listed.
Scatter Plot Construct a scatter plot of the data. Show y and x on the graph."

검증된 단계별 안내
1
Step 1: Identify the variables for the scatter plot. Here, the independent variable (x-axis) is the Year, and the dependent variable (y-axis) is the Average age of vehicles in years.
Step 2: Create a coordinate system with the x-axis labeled as 'Year' and the y-axis labeled as 'Average age (in years)'. Choose an appropriate scale for each axis to accommodate the range of data values.
Step 3: Plot each data point on the graph by pairing each year (x) with its corresponding average age (y). For example, plot the point (2014, 11.4), then (2015, 11.5), and so on for all years up to 2021.
Step 4: After plotting all points, review the scatter plot to observe any trends or patterns, such as whether the average age of vehicles is increasing over the years.
Step 5: Optionally, you can connect the points with a line to better visualize the trend, but remember that a scatter plot primarily shows individual data points.

비슷한 문제에 대한 검증된 영상 답변:

이 영상 해법은 위 문제에 도움이 된다고 튜터들이 추천한 것입니다.
영상 길이:
7m
도움이 되었나요?

주요 개념

질문에 올바르게 답하기 위해 반드시 이해해야 하는 핵심 개념들은 다음과 같습니다.

Scatter Plot

A scatter plot is a graphical representation that displays values for two variables as points on a coordinate plane. Each point corresponds to one observation, with the x-axis representing the independent variable (year) and the y-axis representing the dependent variable (average vehicle age). This helps visualize trends or relationships between variables.
추천 영상:
가이드 코스
07:38
Residuals and Residual Plots

Independent and Dependent Variables

In this context, the year is the independent variable (x), which is controlled or selected, while the average age of vehicles is the dependent variable (y), which changes in response to the year. Understanding this distinction is crucial for correctly plotting and interpreting the data.
추천 영상:
가이드 코스
06:28
Independence Test

Trend Analysis

Trend analysis involves examining data points over time to identify patterns or directions, such as increasing or decreasing trends. Here, plotting the average vehicle age over years helps determine if vehicles are generally getting older on U.S. roads, indicating changes in usage or longevity.
추천 영상:
06:46
Introduction to ANOVA