


Ch. 4 - Probability
Triola - Elementary Statistics 14th Edition
Triola14th EditionElementary StatisticsISBN: 9780137366446당신이 사용하는 게 아니라요?교과서 변경
4장, 문제 4.CQQ.9

In Exercises 6–10, use the following results from tests of an experiment to test the effectiveness of an experimental vaccine for children (based on data from USA Today). Express all probabilities in decimal form.


Find the probability of randomly selecting 2 subjects without replacement and finding that they both developed flu.

검증된 단계별 안내
1
Step 1: Calculate the total number of subjects in the study by summing all the values in the table. Add the number of subjects who developed flu and did not develop flu for both the vaccine treatment and placebo groups.
Step 2: Identify the total number of subjects who developed flu by summing the 'Developed Flu' column for both the vaccine treatment and placebo groups.
Step 3: Calculate the probability of selecting one subject who developed flu. This is done by dividing the total number of subjects who developed flu by the total number of subjects in the study.
Step 4: Since the selection is without replacement, calculate the probability of selecting a second subject who developed flu after the first one has been selected. Subtract 1 from the total number of subjects who developed flu and divide by the total number of subjects minus 1.
Step 5: Multiply the probabilities from Step 3 and Step 4 to find the overall probability of randomly selecting 2 subjects without replacement and finding that they both developed flu.

비슷한 문제에 대한 검증된 영상 답변:

이 영상 해법은 위 문제에 도움이 된다고 튜터들이 추천한 것입니다.
영상 길이:
3m
도움이 되었나요?

주요 개념

질문에 올바르게 답하기 위해 반드시 이해해야 하는 핵심 개념들은 다음과 같습니다.

Probability

Probability is a measure of the likelihood that a particular event will occur, expressed as a number between 0 and 1. In this context, it involves calculating the chance of selecting subjects who developed flu from a given population. Understanding how to compute probabilities, especially in scenarios involving combinations and selections, is crucial for answering the question.
추천 영상:
5:37
Introduction to Probability

Without Replacement

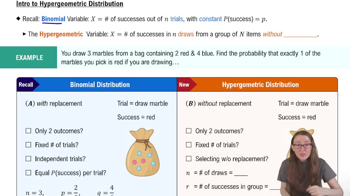
Selecting without replacement means that once an item is chosen from a set, it is not returned to that set for subsequent selections. This affects the total number of items available for the next selection, which in turn influences the probability calculations. In this case, the probability of selecting two subjects who developed flu must account for the reduced pool of subjects after the first selection.
추천 영상:
05:15
Introduction to the Hypergeometric Distribution

Contingency Table

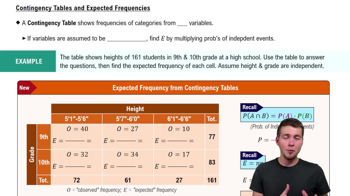
A contingency table is a type of data representation that displays the frequency distribution of variables, allowing for easy comparison of different groups. In this scenario, the table shows the number of subjects who developed flu versus those who did not, categorized by treatment type (vaccine vs. placebo). Analyzing this table is essential for determining the probabilities needed to answer the question.
추천 영상:
가이드 코스
08:18
Contingency Tables & Expected Frequencies
관련 실천
교과서 질문

Cloud Seeding The “Florida Area Cumulus Experiment” was conducted by using silver iodide to seed clouds with the objective of increasing rainfall. For the purposes of this exercise, let the daily amounts of rainfall be represented by units of rnfl. (The actual rainfall amounts are in or )

Find the value of the following statistics and include appropriate units based on rnfl as the unit of measurement.

15.53 7.27 7.45 10.39 4.70 4.50 3.44 5.70 8.24 7.30 4.05 4.46


a. mean

b. median

98
views
교과서 질문

Combination Lock The typical combination lock uses three numbers, each between 0 and 49. Opening the lock requires entry of the three numbers in the correct order. Is the name “combination” lock appropriate? Why or why not?

316
views
교과서 질문

Notation When randomly selecting a new smartphone, D denotes the event that it has a manufacturing defect. What do P(D) and P(D) represent?

195
views
교과서 질문

Heights of Presidents Theories have been developed about the heights of winning candidates for the U.S. presidency and the heights of candidates who were runners up. Listed below are heights (cm) from recent presidential elections. Construct a graph suitable for exploring an association between heights of presidents and the heights of the presidential candidates who were runners-up. What does the graph suggest about that association?

122
views
교과서 질문

Sampling Eye Color Based on a study by Dr. P. Sorita Soni at Indiana University, assume that eye colors in the United States are distributed as follows: 40% brown, 35% blue, 12% green, 7% gray, 6% hazel.


a. A statistics instructor collects eye color data from her students. What is the name for this type of sample?

227
views
교과서 질문

In Exercises 9–20, use the data in the following table, which lists survey results from high school drivers at least 16 years of age (based on data from “Texting While Driving and Other Risky Motor Vehicle Behaviors Among U.S. High School Students,” by O’Malley, Shults, and Eaton, Pediatrics, Vol. 131, No. 6). Assume that subjects are randomly selected from those included in the table. Hint: Be very careful to read the question correctly.


Texting or Drinking If one of the high school drivers is randomly selected, find the probability of getting one who texted while driving or drove when drinking alcohol.

137
views