Skip to main content
Macroeconomics
My Course
Learn
Exam Prep
AI Tutor
Study Guides
Flashcards
Explore
Try the app
My Course
Learn
Exam Prep
AI Tutor
Study Guides
Flashcards
Explore
Try the app
Back
Supply and Demand Together: Both Shift definitions
You can tap to flip the card.
Supply Curve
You can tap to flip the card.
👆
Supply Curve
A graphical representation showing the relationship between price and quantity sellers are willing to offer.
Track progress
Control buttons has been changed to "navigation" mode.
1/15
Related flashcards
Related practice
Recommended videos
Supply and Demand Together: Both Shift quiz
Supply and Demand Together: Both Shift
15 Terms
Supply and Demand Together: Both Shift
3. Supply and Demand
10 problems
Topic
3. Supply and Demand
11 topics
15 problems
Chapter
Guided course
06:34
Results of Both Shifting
2478
views
24
rank
Guided course
07:32
Both Shift - Warning!
3180
views
33
rank
1
comments
Terms in this set (15)
Hide definitions
Supply Curve
A graphical representation showing the relationship between price and quantity sellers are willing to offer.
Demand Curve
A graphical representation showing the relationship between price and quantity buyers are willing to purchase.
Equilibrium Price
The price at which the quantity supplied equals the quantity demanded in a market.
Equilibrium Quantity
The quantity at which the supply and demand curves intersect, indicating market balance.
Ambiguity
A situation where the direction of change for price or quantity cannot be determined after both curves shift.
Graphical Analysis
A visual method for examining the effects of shifts in supply and demand using curves on a graph.
Square Shape
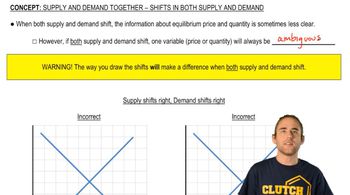
A visual outcome on a graph when both curves are shifted equally, aiding in clear identification of ambiguous variables.
Rightward Shift
A movement of a curve to the right, indicating an increase in supply or demand.
Leftward Shift
A movement of a curve to the left, indicating a decrease in supply or demand.
Double Shift
A scenario where both supply and demand curves are shifted simultaneously on the same graph.
Intersection Point
The spot on a graph where the supply and demand curves cross, indicating equilibrium.
Variable
A factor such as price or quantity whose value is analyzed when curves shift.
Notation
A shorthand method, such as question marks or arrows, used to indicate ambiguity in analysis.
Consistent Analysis
A systematic approach to examining shifts, ensuring reliable identification of ambiguous outcomes.
Scenario
A specific combination of supply and demand shifts used to illustrate possible market outcomes.
 BackBack
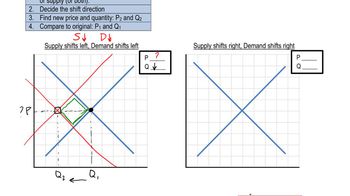
 06:34
06:34