 Back
BackAggregate Demand and Aggregate Supply Analysis: Macroeconomics Study Guide
Study Guide - Smart Notes
 Tailored notes based on your materials, expanded with key definitions, examples, and context.
Chapter 13: Aggregate Demand and Aggregate Supply Analysis
13.1 Aggregate Demand
Aggregate demand (AD) represents the total quantity of goods and services demanded across all levels of the economy at a given price level. Understanding its determinants and the distinction between movements along the curve and shifts of the curve is essential for macroeconomic analysis.
Components of Real GDP: Consumption (C), Investment (I), Government Purchases (G), Net Exports (NX). The sum of these components gives real GDP.
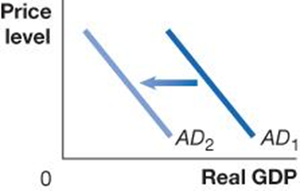
Aggregate Demand Curve: Shows the relationship between the price level and the quantity of real GDP demanded by households, firms, and the government.
Determinants of AD: Consumption, investment, and net exports are affected by changes in the price level, while government purchases are generally independent of price level changes.
Three Effects Explaining Downward Slope:
Wealth Effect: As price levels rise, the real value of household wealth declines, reducing consumption.
Interest-Rate Effect: Higher price levels increase demand for money, raising interest rates and discouraging investment.
International-Trade Effect: Higher U.S. price levels make exports more expensive and imports cheaper, reducing net exports.
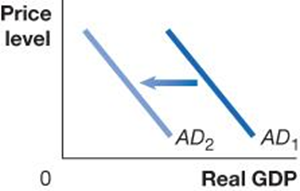
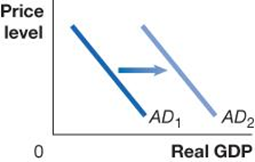
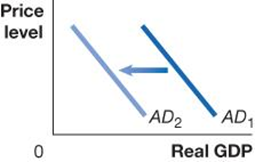
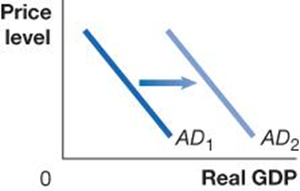
Movements vs. Shifts:
Movement along AD curve: Caused by changes in the price level, holding other factors constant.
Shift of AD curve: Caused by changes in components of real GDP (e.g., government purchases, consumer confidence, foreign income).
Variables That Shift the Aggregate Demand Curve
Variable | Effect on AD |
|---|---|
Monetary Policy | Interest rate changes affect investment spending |
Fiscal Policy | Tax and government purchase changes affect consumption and investment |
Expectations | Optimism increases AD; pessimism decreases AD |
Foreign Income & Exchange Rates | Higher foreign income increases AD; stronger dollar decreases AD |


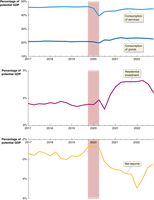
Example: 2020 Recession and Aggregate Demand Components
Consumption spending fell, especially on services.
Residential investment increased due to low interest rates and stimulus.
Net exports decreased, partly due to a stronger dollar and lower foreign GDP.


13.2 Aggregate Supply
Aggregate supply (AS) refers to the total quantity of goods and services firms are willing and able to supply at different price levels. The relationship between price level and real GDP supplied differs in the short run and long run.
Long-Run Aggregate Supply (LRAS): Vertical line at potential GDP, determined by labor, capital, and technology. Not affected by price level.
Short-Run Aggregate Supply (SRAS): Upward sloping due to sticky wages and prices, slow wage adjustments, and menu costs.
Sticky Prices and Wages: Contracts, slow wage adjustments, and menu costs cause prices and wages to respond slowly to changes in demand or supply.
Why Is SRAS Upward Sloping?
Sticky Wages and Prices: Long-term contracts and slow wage reviews.
Menu Costs: Firms may avoid small price changes due to associated costs.
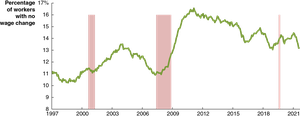
Example: Wage Stickiness
Firms often freeze pay or reduce new hire salaries rather than cut wages for current workers.
Shifts of the SRAS Curve
Movement along SRAS: Caused by price level changes, holding other factors constant.
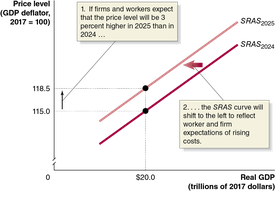
Shift of SRAS: Caused by changes in factors such as labor/capital availability, technology, expected future prices, and supply shocks.
Variable | Effect on SRAS |
|---|---|
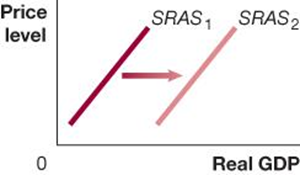
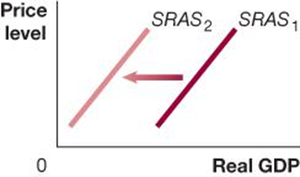
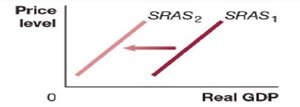
Labor/Capital Availability | Increase shifts SRAS right; decrease shifts left |
Technology | Improvements shift SRAS right |
Expected Future Prices | Higher expectations shift SRAS left |
Supply Shocks | Negative shocks shift SRAS left; positive shocks shift right |


13.3 Macroeconomic Equilibrium in the Long Run and the Short Run
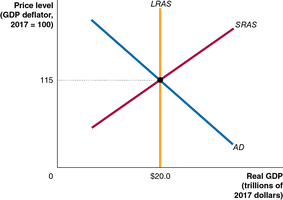
Macroeconomic equilibrium occurs where aggregate demand and aggregate supply intersect. The distinction between short-run and long-run equilibrium is crucial for understanding economic fluctuations.
Long-Run Equilibrium: AD and SRAS intersect at LRAS, with GDP at full employment.
Short-Run Effects:
Decrease in AD: Causes recession; SRAS eventually shifts right, restoring equilibrium at a lower price level.
Increase in AD: Causes expansion; SRAS eventually shifts left, restoring equilibrium at a higher price level.
Supply Shock: SRAS shifts left, causing stagflation; SRAS may shift right over time, or policy may increase AD.
Example: Covid-19 Pandemic Effects
Both AD and SRAS shifted left due to reduced consumption, investment, and exports, resulting in lower real GDP and steady prices.
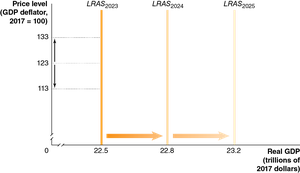
13.4 A Dynamic Aggregate Demand and Aggregate Supply Model
The dynamic model incorporates ongoing growth, inflation, and shifts in AD, SRAS, and LRAS. It is used to analyze macroeconomic conditions over time.
Dynamic Factors:
LRAS shifts right due to growth
AD usually shifts right
SRAS shifts right unless inflation expectations are high
Inflation: Occurs when AD increases faster than LRAS; SRAS shifts less than LRAS due to anticipated price increases.
Main Factors Causing the Recession of 2007–2009
Housing Bubble: Speculation and low interest rates led to rising house prices, which deflated in 2006.
Financial Crisis: Mortgage defaults caused losses for financial institutions, leading to a credit crunch.
Oil Price Shock: Rapid increase in oil prices exacerbated the recession.
Appendix: Macroeconomic Schools of Thought
Macroeconomic theory includes several schools of thought, each with distinct views on economic fluctuations and policy.
School | Main Ideas |
|---|---|
Keynesian | Emphasizes sticky wages/prices; government intervention |
Monetarist | Focuses on money supply; advocates monetary growth rule |
New Classical | Rational expectations; correct expectations minimize fluctuations |
Real Business Cycle | Productivity shocks drive business cycles; supply is vertical |
Austrian | Market system superior; central bank-induced cycles |
Marxist | Labor theory of value; predicts eventual worker control |
Note: No single school is universally accepted; debate continues regarding optimal policies.
