Back
Aggregate Demand and Aggregate Supply: Principles and Applications
Study Guide - Smart Notes
 Tailored notes based on your materials, expanded with key definitions, examples, and context.
Product Market
Definition and Scope
The product market is a highly aggregated market where domestic firms supply goods and services, and households, investors, government, and foreigners demand these goods and services. It encompasses all items included in GDP, and real GDP can be considered the 'good' traded in this market. The product market is also referred to as the goods and services market.
Suppliers: Domestic firms
Demanders: Households, investors, government, foreigners
Key metric: Real GDP
Model of Aggregate Demand (AD) and Aggregate Supply (AS)
Overview and Purpose
The AD/AS model is used by macroeconomists to analyze the effects of economic events ("shocks") on the economy. It explains short-run fluctuations in economic activity around the long-run trend and determines equilibrium real GDP and price level. The model is also used to predict the effects of economic shocks by analyzing how they shift AD or AS and change equilibrium.
AD: Aggregate demand
AS: Aggregate supply (short-run and long-run)
Equilibrium: Intersection of AD and AS curves
Aggregate Demand (AD)
Definition and Properties
Aggregate demand (AD) is the demand curve indicating the value of real GDP that purchasers are willing and able to buy at different price levels. It is downward sloping, reflecting the relationship between price level and real GDP demanded.
Formula:
Downward slope: Indicates higher real GDP demanded at lower price levels
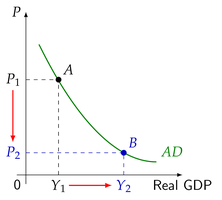
Why is the AD Curve Downward Sloping?
Unlike microeconomics, there is no "law of demand" for aggregate demand. Instead, three effects explain the downward slope:
Wealth effect: Lower price level increases real wealth, boosting consumption.
Interest rate effect: Lower price level reduces money demand, lowers real interest rates, and increases consumption and investment.
International trade effect: Lower price level makes domestic goods cheaper relative to foreign goods, increasing exports and decreasing imports (raising net exports).
Short Run vs. Long Run
Definitions
The short run is a period during which some prices (especially resource prices) are "sticky" and cannot change due to prior agreements. The long run is a period long enough for all prices and agreements to be renegotiated, so no price is sticky.
Short run: Sticky prices, e.g., nominal wages fixed by contracts
Long run: Flexible prices, all agreements can be renegotiated
Short-Run Aggregate Supply (SRAS)
Definition and Properties
Short-run aggregate supply (SRAS) is the supply curve indicating the quantities of real GDP that domestic firms will supply in response to changing price levels. The SRAS curve is upward sloping due to sticky resource prices; higher prices increase profitability and production.
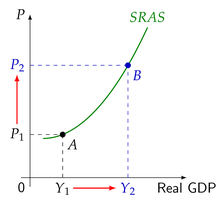
Long-Run Aggregate Supply (LRAS)
Definition and Properties
Long-run aggregate supply (LRAS) shows the relationship between price level and real GDP supplied after all agreements are renegotiated. LRAS reflects the economy’s production possibilities frontier (PPF) and is vertical, indicating that price level changes do not affect real GDP in the long run.
LRAS: Vertical at full-employment real GDP
Constraints: Resource base, technology, institutions
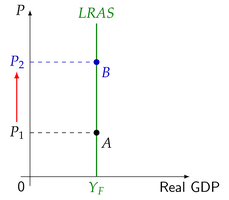
Equilibrium in the AD/AS Model
Short-Run Equilibrium
Short-run equilibrium occurs where the AD and SRAS curves intersect. This determines the current real GDP and price level.
Long-Run Equilibrium
Long-run equilibrium occurs when the economy operates at full employment, actual unemployment equals the natural rate, and real GDP equals the maximum sustainable output.
Full employment: All resources are fully utilized
Natural rate of unemployment: Actual equals natural rate
Real GDP: Equals full-employment level
Factors that Shift Aggregate Demand
Key Factors
Aggregate demand can shift due to changes in:
Consumption: Changes in consumer confidence, wealth, taxes
Investment: Changes in real interest rates, business expectations
Government spending: Fiscal policy changes
Net exports: Changes in exchange rates, foreign income
Factors that Shift Long-Run Aggregate Supply
Key Factors
Shifts in LRAS reflect changes in the economy’s PPF:
Resource availability: More resources increase LRAS; fewer resources decrease LRAS
Technology and productivity: Improvements increase LRAS; deterioration decreases LRAS
Institutions: Better institutions increase LRAS; worse institutions decrease LRAS
Factors that Shift Short-Run Aggregate Supply
Key Factors
SRAS can shift due to changes in resource prices, expectations about inflation, or temporary events like weather.
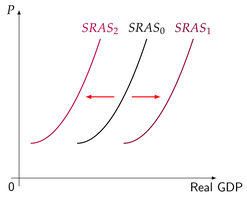
Effects of Aggregate Demand and Supply Shocks
Positive AD Shock (Short Run)
A positive AD shock (e.g., depreciation of domestic currency) temporarily increases real GDP above the full-employment level, lowers unemployment below the natural rate, and raises the price level.
Positive AD Shock (Long Run)
Over time, resource prices adjust upward, SRAS decreases, and real GDP returns to the full-employment level.
Positive SRAS Shock
Temporary changes in resource prices or expectations can increase SRAS, temporarily raising real GDP above full employment. Eventually, SRAS returns to its original position and real GDP returns to full employment.
Potential GDP and Data Exploration
Finding Potential GDP
Potential GDP (full-employment GDP) estimates can be found in the FRED database of the Federal Reserve Bank of St. Louis, sourced from the U.S. Congressional Budget Office (CBO).
FRED database: fred.stlouisfed.org
Series: Real Potential Gross Domestic Product (GDPPOT)
Consumption Spending in the News
Recent Trends
Recent news articles highlight unexpected declines in U.S. retail sales and signs of weakening consumer sentiment, reflecting the importance of consumption in aggregate demand.
Retail sales: Fell 0.6% last month, largest decrease since May 2025
Consumer sentiment: University of Michigan index at lowest since November
Economics Joke
Comic Strip
Humor in economics can illustrate concepts or lighten the mood. The comic strip below pokes fun at the wisdom (or lack thereof) of economists.