 Back
BackAggregate Demand and Supply: Determinants, Shocks, and Macroeconomic Equilibrium
Study Guide - Smart Notes
 Tailored notes based on your materials, expanded with key definitions, examples, and context.
Aggregate Demand and Aggregate Supply
Introduction to Aggregate Demand and Supply
The aggregate demand (AD) and aggregate supply (AS) model is a fundamental framework in macroeconomics for analyzing the overall price level and output in an economy. It helps explain fluctuations in real GDP and the price level due to various economic events and policy changes.
Aggregate Demand (AD)
Definition: Aggregate demand represents the total quantity of goods and services demanded across all levels of an economy at various price levels, holding other factors constant.
Downward Slope: The AD curve slopes downward because higher price levels reduce the real value of wealth, decrease consumption, and make domestic goods more expensive relative to foreign goods, reducing exports and increasing imports.
Key Effects:
Wealth Effect: As the price level rises, the real value of household wealth falls, leading to lower consumption.
Net Export Effect: Higher domestic prices make exports less competitive and imports more attractive, reducing net exports.
Shifters of AD:
Changes in wealth
Tax changes
Government spending
Export spending
Investment spending
Interest rates
Formula: Where: C = Consumption, I = Investment, G = Government spending, X = Exports, M = Imports
Aggregate Supply (AS)
Definition: Aggregate supply shows the total quantity of goods and services that firms are willing and able to produce at different price levels, given technology and factor prices.
Upward Slope: The AS curve is positively sloped, meaning higher prices incentivize firms to increase output. The curve becomes steeper as output rises due to capacity constraints.
Shifters of AS:
Changes in factor costs (e.g., wages, raw materials)
Technological changes
Labor market conditions
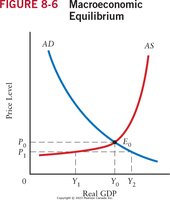
Macroeconomic Equilibrium
Determination of Equilibrium
Macroeconomic equilibrium occurs where the aggregate demand and aggregate supply curves intersect. At this point, the quantity of output demanded equals the quantity supplied, determining the equilibrium price level and real GDP.
Equilibrium Point (E0): The intersection of AD and AS determines the equilibrium price level (P0) and output (Y0).
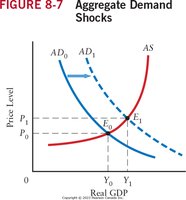
Shocks and Adjustments in the AD-AS Model
Aggregate Demand Shocks
An aggregate demand shock is a sudden change in any component of AD (such as consumption, investment, government spending, or net exports) that shifts the AD curve. For example, an increase in autonomous expenditure shifts the AD curve to the right, raising both the equilibrium price level and output.
Short-Run Effects: The shift in AD is divided between a change in real GDP (Y) and a change in the price level (P). The steeper the AS curve, the smaller the output effect and the larger the price effect.
Example: An increase in government spending shifts AD rightward, increasing both P and Y in the short run.
Aggregate Supply Shocks
Aggregate supply shocks are sudden changes in production costs or technology that shift the AS curve. A negative supply shock (e.g., higher oil prices or a natural disaster) shifts AS leftward, causing the price level to rise and output to fall.
Key Point: AS shocks cause price and output to move in opposite directions.
Example: A rise in wage rates increases production costs, shifting AS left and raising prices while reducing output.
Analyzing Macroeconomic Events with the AD-AS Model
Application: Effects of Specific Events
Increase in household expectations of future income: Likely increases consumption, shifting AD rightward, raising both P and Y.
Improved business expectations for future income: Increases investment spending, shifting AD rightward, raising both P and Y.
Domestic income growing faster than foreign income: Increases imports relative to exports, reducing net exports and shifting AD leftward, lowering P and Y.
Appreciation of the Canadian dollar ($CDN): Makes Canadian goods more expensive abroad and imports cheaper, reducing exports and increasing imports, shifting AD leftward, lowering P and Y.
Summary Table: Effects of Shocks on AD and AS
Shock/Event | Curve Shifted | Direction | Effect on Price Level (P) | Effect on Output (Y) |
|---|---|---|---|---|
Increase in household income expectations | AD | Right | Up | Up |
Improved business expectations | AD | Right | Up | Up |
Domestic income grows faster than foreign | AD | Left | Down | Down |
Appreciation of $CDN | AD | Left | Down | Down |
Increase in factor costs | AS | Left | Up | Down |
Additional info: The above notes expand on the brief points in the source material, providing definitions, examples, and a summary table for clarity. The included images directly illustrate macroeconomic equilibrium and aggregate demand shocks as discussed in the text.
