 Back
BackAn Introduction to Basic Macroeconomic Markets: Circular Flow, Aggregate Demand and Supply, and Key Markets
Study Guide - Smart Notes
 Tailored notes based on your materials, expanded with key definitions, examples, and context.
Chapter 9: An Introduction to Basic Macroeconomic Markets
Understanding Macroeconomics: The Circular Flow Model
The circular flow model is a foundational tool in macroeconomics, illustrating the inter-relationships between different sectors of the economy. It demonstrates how income and output circulate between households and businesses, coordinated by four key markets.
Resource Market: Businesses demand resources (labor, capital, land), and households supply them in exchange for income.
Goods and Services Market: Coordinates the supply and demand for domestically produced goods and services (GDP).
Loanable Funds Market: Balances household savings and foreign capital inflows with borrowing by businesses and governments.
Foreign Exchange Market: Balances imports (purchases from foreigners) with exports and net capital inflows (sales to foreigners).
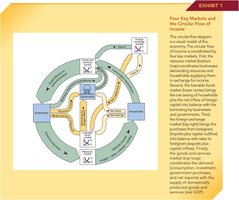
Additional info: The circular flow model helps visualize how changes in one market can affect the entire economy, emphasizing the interconnectedness of macroeconomic variables.
Aggregate Demand and Aggregate Supply
Aggregate Demand (AD)
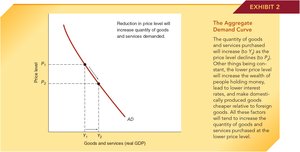
The aggregate demand curve shows the total quantity of goods and services demanded across all levels of price in an economy. It slopes downward, indicating that as the general price level falls, the quantity of goods and services demanded increases.
Wealth Effect: Lower price levels increase the real value of money holdings, boosting consumer wealth and spending.
Interest Rate Effect: Lower prices reduce the demand for money, leading to lower interest rates and increased investment.
Foreign Purchases Effect: Lower domestic prices make domestic goods more attractive relative to foreign goods, increasing exports.
Equation: The aggregate demand function can be represented as: where is real GDP, is consumption, is investment, is government spending, is exports, and is imports.
Aggregate Supply (AS)
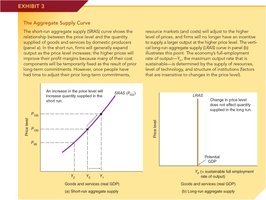
Aggregate supply represents the total quantity of goods and services that firms are willing and able to produce at different price levels. It is divided into short-run and long-run aggregate supply.
Short-Run Aggregate Supply (SRAS)
The SRAS curve is upward sloping because, in the short run, some input prices are fixed due to contracts and other rigidities. As the price level rises, firms increase output to take advantage of higher profit margins.
Long-Run Aggregate Supply (LRAS)
The LRAS curve is vertical at the economy's full employment output (potential GDP), indicating that in the long run, output is determined by resources, technology, and institutions, not by the price level.

Additional info: The distinction between SRAS and LRAS is crucial for understanding how economies adjust to shocks and policy changes over time.
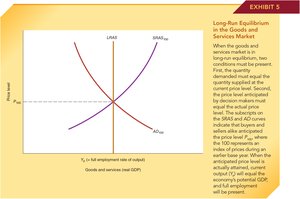
Equilibrium in the Goods and Services Market
Short-Run Equilibrium
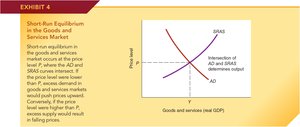
Short-run equilibrium occurs where the aggregate demand (AD) curve intersects the short-run aggregate supply (SRAS) curve. At this point, the quantity of goods and services demanded equals the quantity supplied at the prevailing price level.
If the price level is below equilibrium, excess demand will push prices up.
If the price level is above equilibrium, excess supply will push prices down.
Long-Run Equilibrium
Long-run equilibrium is achieved when the AD, SRAS, and LRAS curves all intersect at the same point. At this equilibrium, output equals potential GDP, and the economy operates at full employment.
All expectations about prices are fulfilled, and there is no incentive for firms or workers to change their behavior.
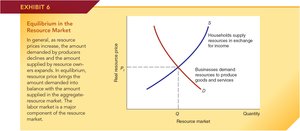
The Resource Market
The resource market is where businesses acquire the inputs needed for production, such as labor, capital, and raw materials. Households supply these resources in exchange for income.
Equilibrium in the resource market occurs when the quantity of resources demanded equals the quantity supplied at the prevailing price.
The labor market is a major component of the resource market.
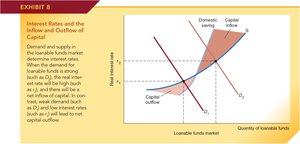
The Loanable Funds Market
The loanable funds market brings together savers (who supply funds) and borrowers (who demand funds). The equilibrium interest rate is determined by the interaction of supply and demand for loanable funds.
Real Interest Rate: The interest rate adjusted for inflation, reflecting the true cost of borrowing.
Nominal Interest Rate: The stated interest rate, not adjusted for inflation.
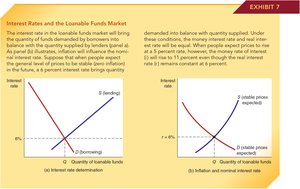
Equation: The Fisher equation relates nominal and real interest rates: where is the nominal interest rate, is the real interest rate, and is expected inflation.
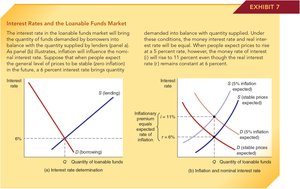
Additional info: When inflation expectations rise, nominal interest rates increase to compensate lenders for the loss of purchasing power.
Interest Rates and Capital Flows
Interest rates influence international capital flows. High real interest rates attract foreign capital (capital inflow), while low rates may lead to capital outflow.
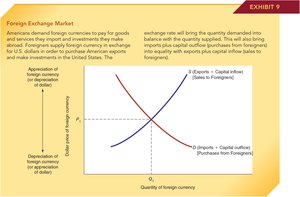
The Foreign Exchange Market
The foreign exchange market determines the value of one currency relative to another. It balances the demand for foreign currency (to pay for imports and investments abroad) with the supply of foreign currency (from exports and foreign investments in the domestic economy).
Exchange Rate: The price of one currency in terms of another.
Equilibrium occurs when the quantity of foreign currency demanded equals the quantity supplied.
Capital Flows and Trade Flows
There is a close relationship between a country's capital flows and its trade balance. A trade deficit (imports > exports) is typically financed by a net inflow of capital from abroad.
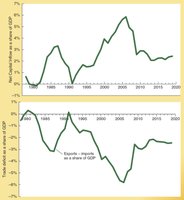
Additional info: Whether trade deficits are harmful depends on how the borrowed funds are used. If invested productively, they can boost future income; if used for consumption, they may reduce future growth.
Summary Table: The Four Key Macroeconomic Markets
Market | Main Function | Key Participants | Equilibrium Variable |
|---|---|---|---|
Resource Market | Coordinates supply and demand for productive resources | Households, Businesses | Resource price (e.g., wage rate) |
Goods & Services Market | Coordinates supply and demand for final goods and services (GDP) | Households, Businesses, Government, Foreigners | Price level |
Loanable Funds Market | Balances saving and investment (borrowing/lending) | Households, Businesses, Government, Foreigners | Interest rate |
Foreign Exchange Market | Balances currency supply and demand for international transactions | Domestic and Foreign Buyers/Sellers | Exchange rate |
